Community tools
Pick your district or mark a place, and ask a question. We read years of satellite records, do the sums on our server and send back a plain answer with the numbers, a chart or map, and a one-page sheet to print or share. It's free, it works on a phone and a slow connection, and you don't need any GIS software or training.
For farmers and herders
Questions about one farm, one water point or one village.
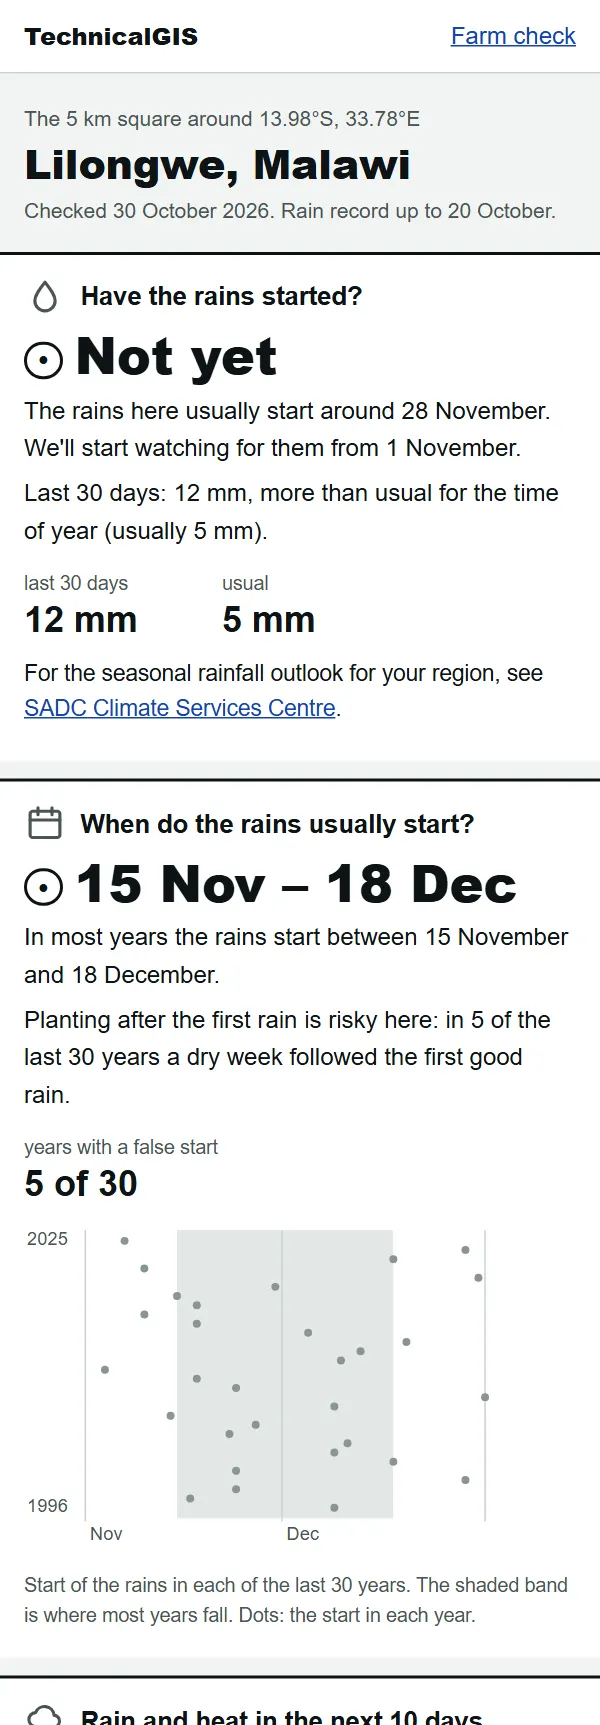
Farm check
Have the rains started on my farm, and does my crop need water?
Mark your farm for five answers: have the rains started, when they usually start, the next 10 days, how green the crops are and how much water your crop needs.
Ready in about a minute.
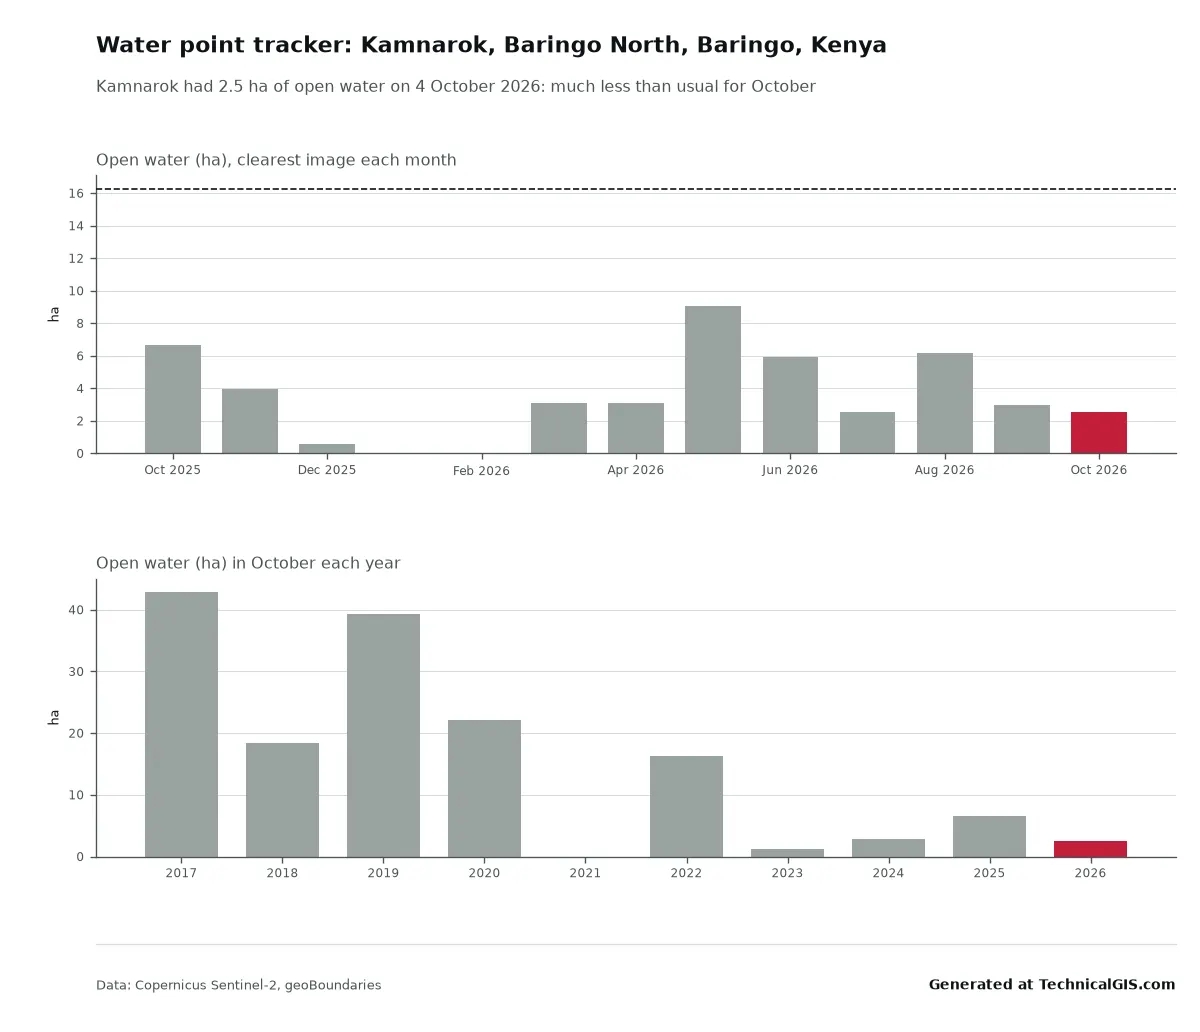
Water point tracker
Is there still water at this pan, dam or pond?
Mark a pan, dam or pond and we'll show how much open water it held in each recent satellite image, and how that compares with the same time in past years.
Ready in about a minute. Supports Goal 6 (Clean water) and Goal 2 (Zero hunger).
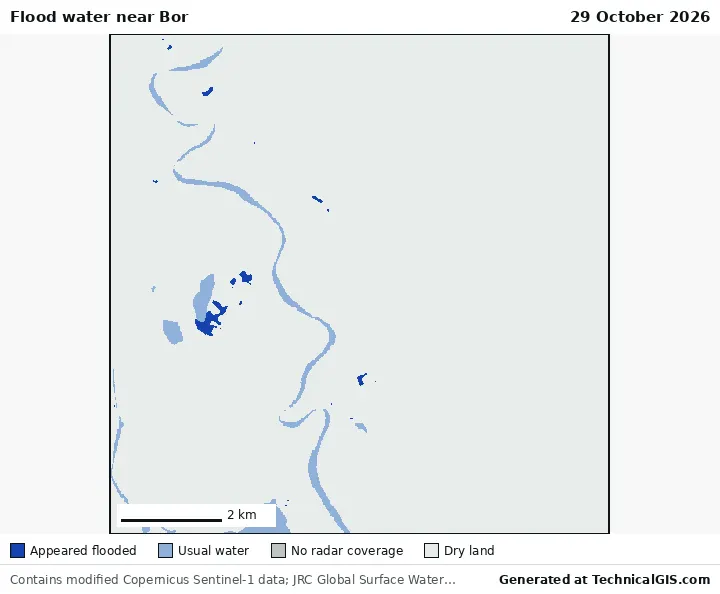
Flood now
Is there flood water near my village right now?
Mark your village or farm and we'll check the latest radar image for new flood water within 5 km, how much land it covers and how many people live there.
Ready in about a minute. Supports Goal 11 (Sustainable cities and communities) and Goal 13 (Climate action).
For district offices and NGOs
Bulletins for a whole district, to print, pin up or send round.
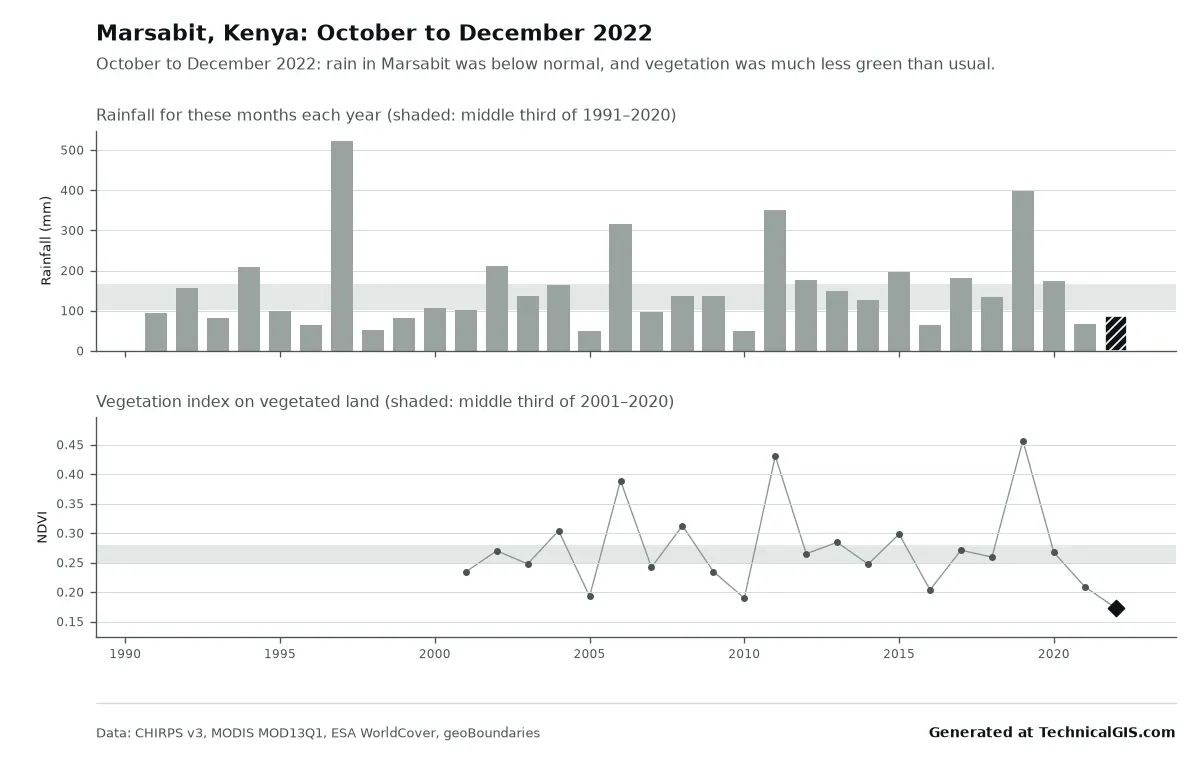
Season condition
Is this season better or worse than usual?
Choose your district and we'll tell you whether this season's rain and crop growth are better or worse than usual, and where this year ranks since 1991.
Ready in about one minute. Supports Goal 2 (Zero hunger) and Goal 13 (Climate action).
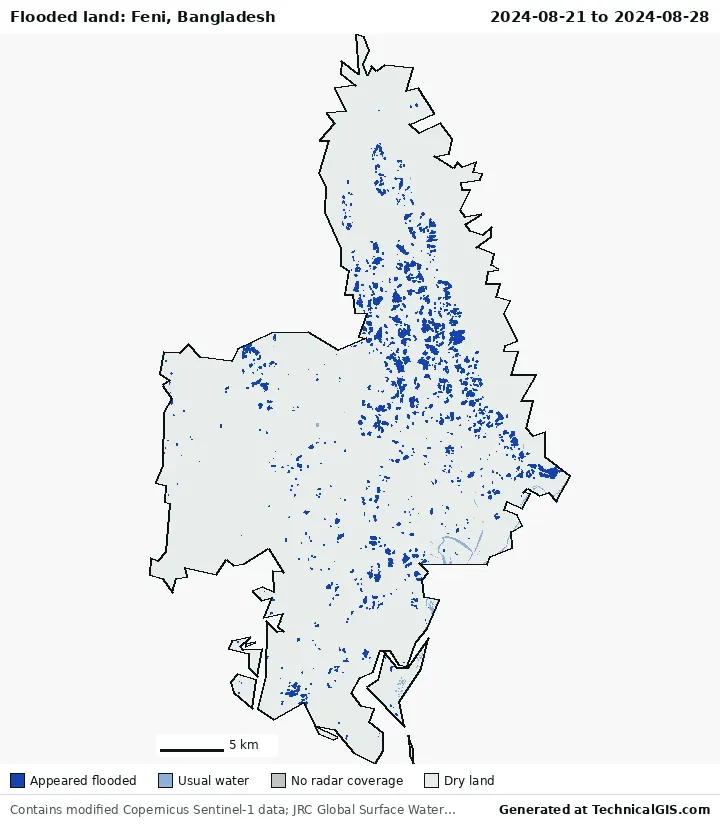
Flood impact
Where did it flood, and how many people live there?
Choose your district and a date, and we'll map the land that flooded from satellite radar and count how many people live there. Radar sees through cloud, so it works in the middle of the rains.
Ready in one to three minutes. Supports Goal 11 (Sustainable cities and communities) and Goal 13 (Climate action).
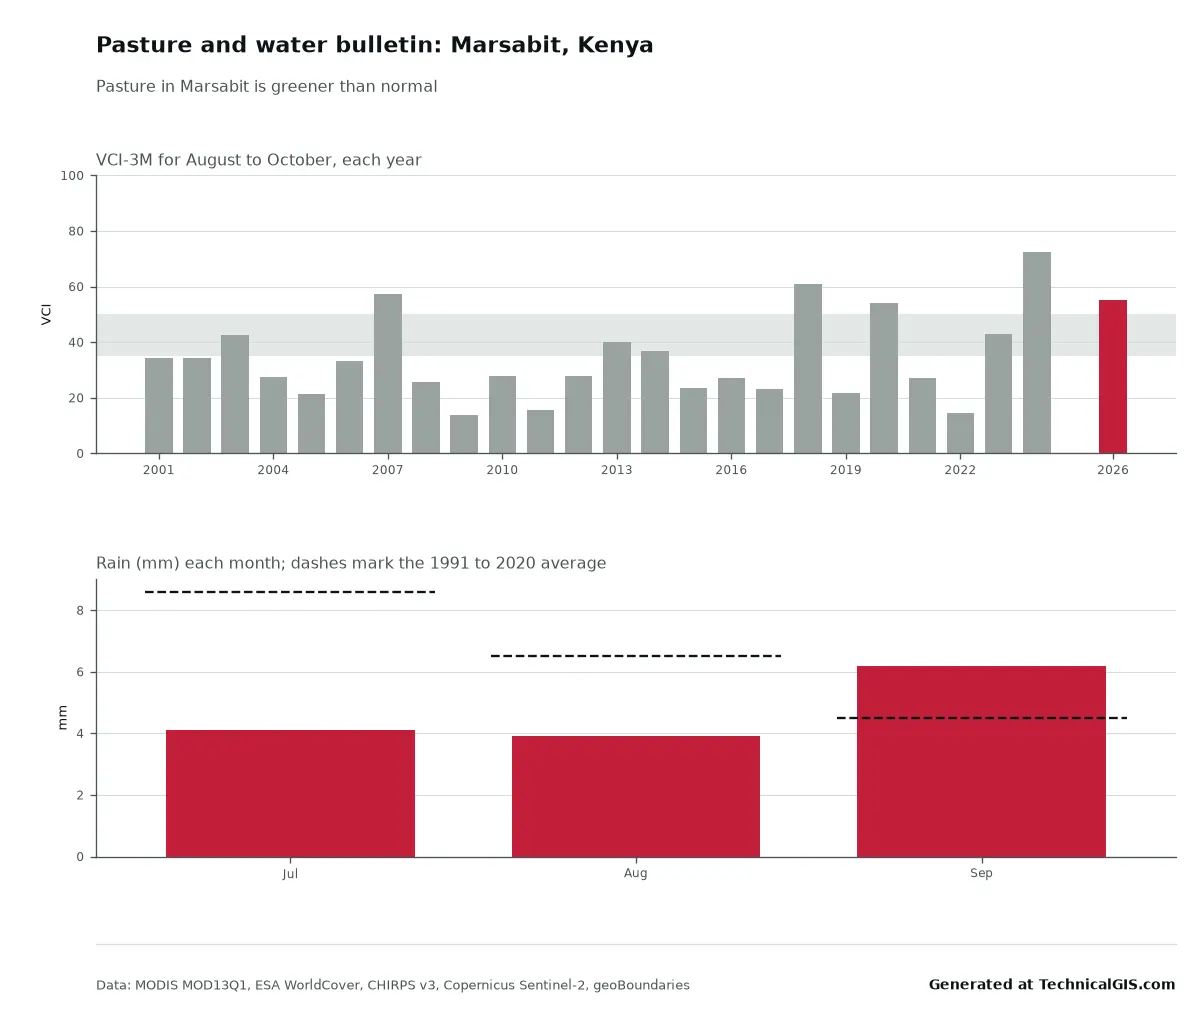
Pasture and water bulletin
How are the pasture and the water points this month?
A monthly-style bulletin for a pastoral district: how green the grazing is against every year since 2001, the rain, and whether up to three named water points still hold water.
Ready in two to three minutes. Supports Goal 1 (No poverty), Goal 2 (Zero hunger) and Goal 15 (Life on land).
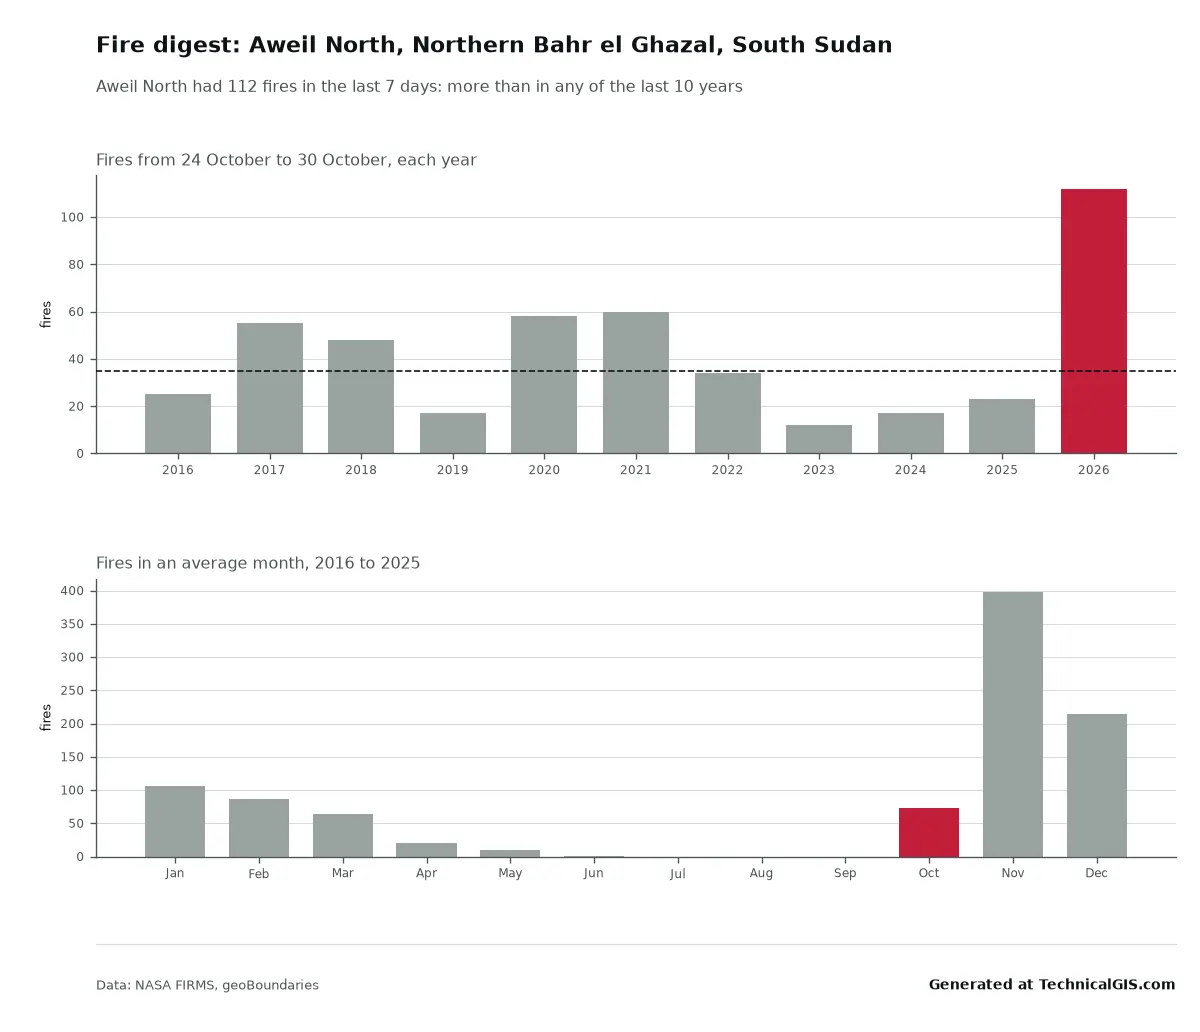
Fire digest
How many fires were there this week, and is that more than usual?
Satellite fire counts for your district over the last seven days, set against the same week in each of the last ten years, with a map of where they were.
Ready in under a minute. Supports Goal 13 (Climate action) and Goal 15 (Life on land).
Locusts? FAO's Desert Locust Watch publishes the official situation reports and forecasts for every affected country. We link to it from the pasture bulletin rather than make our own.
For insurers and cooperatives
Checks that help you choose fair rainfall cover.
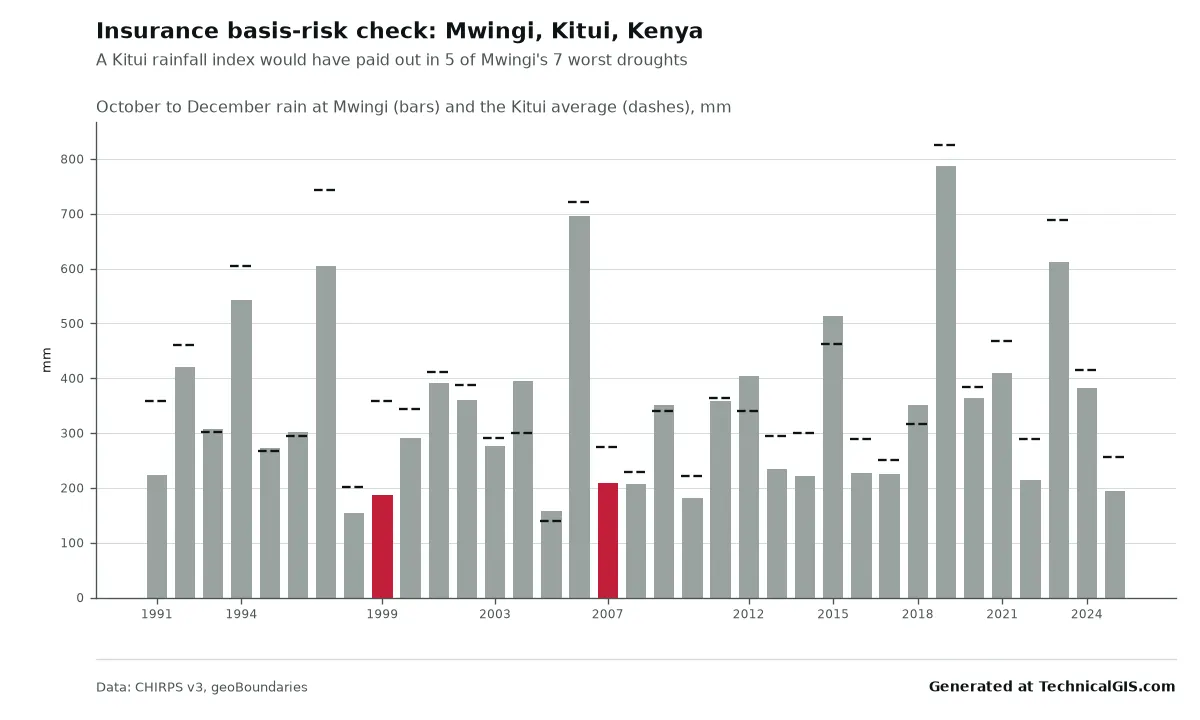
Real answers
In Marsabit County, Kenya, October to December 2022 brought 86 mm of rain, about half the usual amount, and the land was less green than in any year since 2001. In Feni district, Bangladesh, radar on 21 and 28 August 2024 showed about 39 km² of newly flooded land, home to about 4,400 people. Try the Marsabit question or the Feni one, and read the launch article to see how they match reports from the time. For pasture in Marsabit, fires in South Sudan, a drying lake in Baringo and a rainfall index in Kitui, read the pasture, water, fire and flood tools article.
Coverage
- 200 countries and territories
- 52,236 districts and provinces
- 80 low and lower-middle-income countries
- 90 days each answer is kept, shareable by link
District boundaries come from geoBoundaries: districts or counties where they're available, provinces or regions otherwise. Everywhere between 60° north and south is covered. Each answer names its country's boundary licence; 58 countries use a share-alike licence for the outlines.
| Licence | Countries |
|---|---|
| CC BY 3.0 IGO | 48 |
| ODbL 1.0 | 43 |
| CC BY 4.0 | 40 |
| Public domain | 33 |
| CC BY-SA 2.0 | 9 |
| CC BY 3.0 | 7 |
| CC BY-SA 3.0 | 6 |
| CC0 1.0 | 5 |
| CC BY 2.5 | 3 |
| OGL Canada 2.0 | 1 |
| PDDL 1.0 | 1 |
| Etalab 2.0 | 1 |
| DL-DE-BY-2.0 | 1 |
| Singapore ODL 1.0 | 1 |
| OGL v3.0 | 1 |
Data and credits
Every source lets anyone reuse the results, including in reports and funding bids. We checked each licence on the provider's own page, last on 29 October 2026.
| Source | Used for | Licence |
|---|---|---|
| CHIRPS v3 rainfall | Rainfall | CC BY 4.0 |
| MODIS MOD13Q1 v061 vegetation index | Vegetation greenness and pasture | NASA open data, no restrictions on use |
| ESA WorldCover 2021 land cover | Cropland mask | CC BY 4.0 |
| Sentinel-1 radiometrically terrain corrected backscatter | Flood detection | CC BY 4.0 |
| Copernicus Sentinel-2 Level-2A imagery | Water points | Copernicus Sentinel data legal notice (free, full and open use, including commercial) |
| NASA FIRMS MODIS active fires (Collection 6.1) | Fires | NASA open data, no restrictions on use |
| JRC Global Surface Water occurrence | Removing usual water | Free of charge, without restriction of use (Copernicus programme) |
| GHSL GHS-POP R2023A population grid (2025) | People in the flooded area | CC BY 4.0 |
| geoBoundaries administrative boundaries | District boundaries | Per country (CC BY, ODbL or open government licence) |
Bigger questions
Each visitor can ask 15 new questions a day, shared with the climate tools; answers we've already worked out are instant and free. For a whole region, a run of dates, regular updates or a different question, talk to us about your project. Read what we're for.