Spatial Analysis

Location-aware statistics: hot spots, kriging, regression and GWR, point patterns and KDE, clustering and regionalisation, accessibility and location-allocation, accuracy and trend tests.

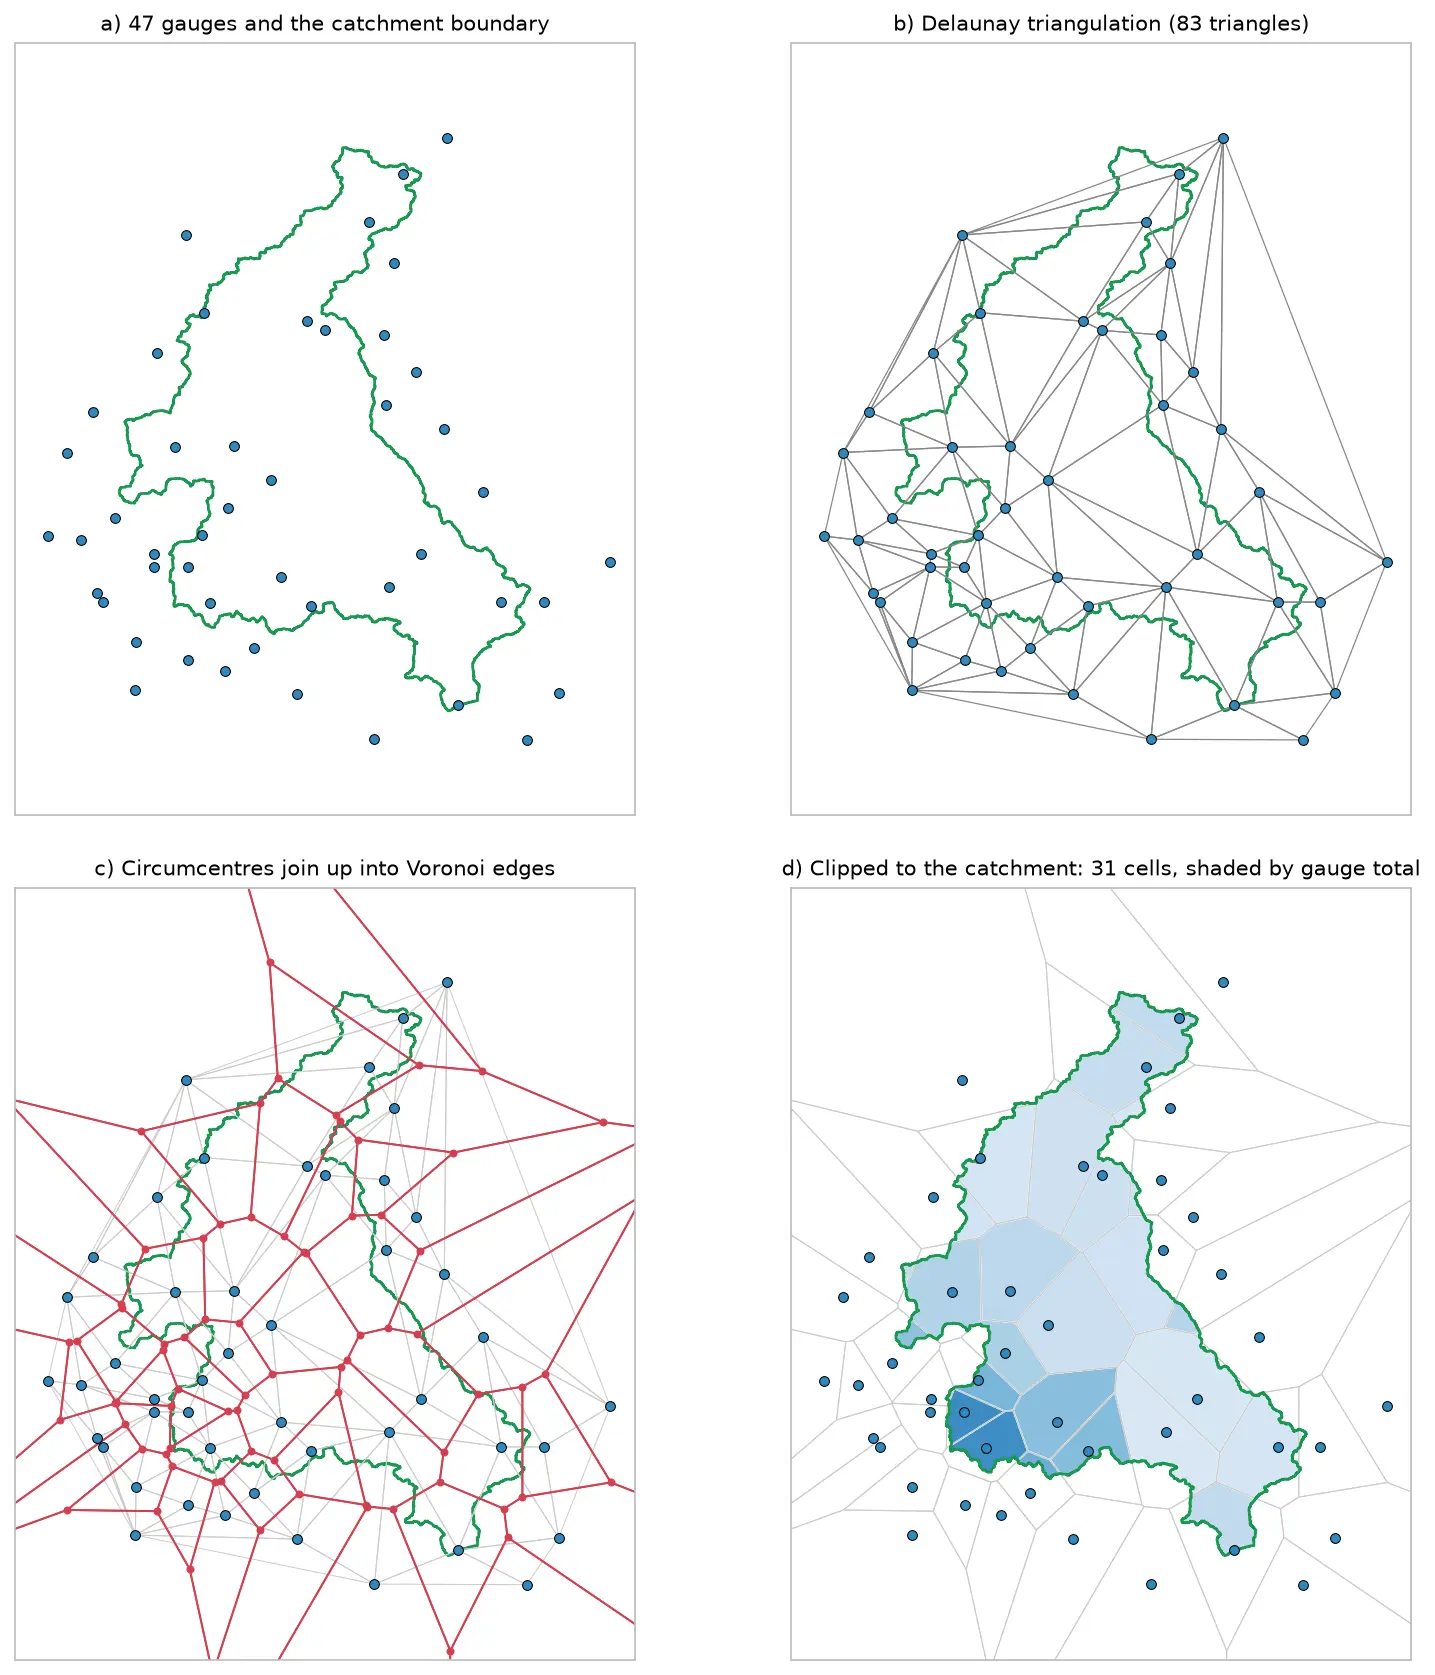
Four panels showing how Voronoi polygons are built for 47 rain gauges around the River Eden catchment: the gauges and the catchment outline, their Delaunay triangulation, the triangle circumcentres joined into red Voronoi edges, and the cells clipped to the catchment and shaded by each gauge's rainfall.

Tutorial Python

Voronoi (Thiessen) polygons in Python: catchment rainfall from EA rain gauges and fire station areas in Cumbria

Build Voronoi (Thiessen) polygons in Python with shapely and GeoPandas, clipped to a real boundary. Compute Thiessen-weighted catchment rainfall for the River Eden from Environment Agency rain gauge readings, check the gauges, compare with the gauge average and IDW, then compare Voronoi 'nearest fire station' areas in Cumbria with drive-time service areas from OpenStreetMap.
Intermediate 15 min read

Tutorial Python

Geocoding in Python: batch and reverse geocoding with geopy, Nominatim and postcodes.io

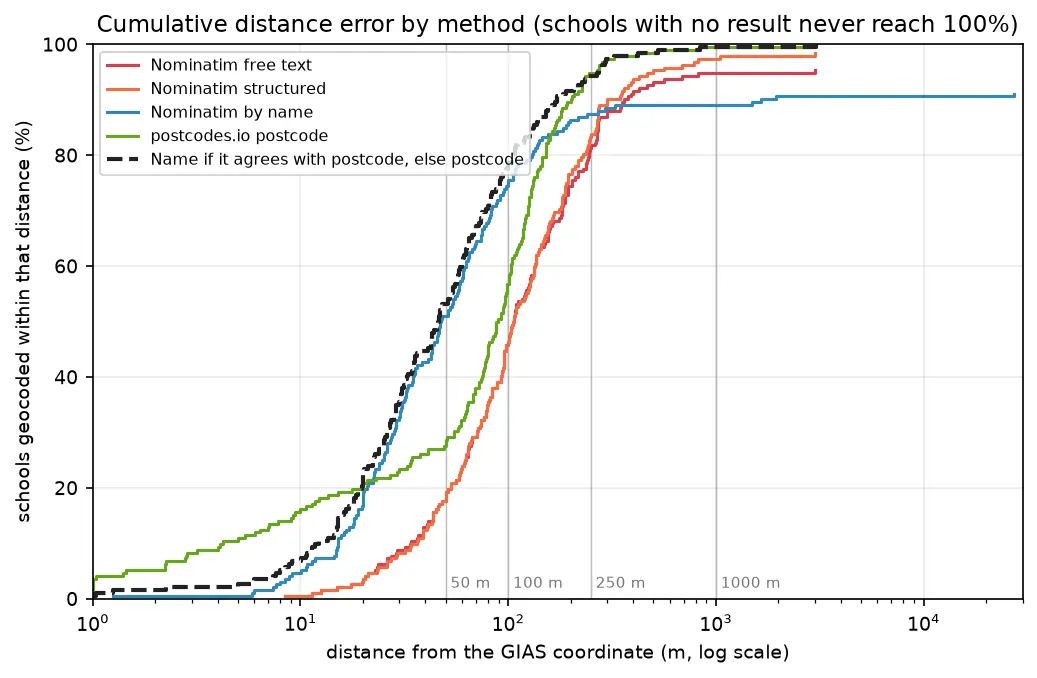
Batch geocode all 192 open schools in Sheffield in Python with geopy and OpenStreetMap Nominatim (1 request per second, a custom user agent and an on-disk cache) and with postcodes.io bulk postcode lookups, reverse geocode a sample, and measure every method honestly against the Department for Education's own coordinates. Covers free text against structured queries, failure modes, cross-checking two geocoders, and the licensing of geocoded results.

Beginner 14 min read

Tutorial Python

GPS data analysis in Python with MovingPandas: trajectories, speed, stops, generalisation and flow maps

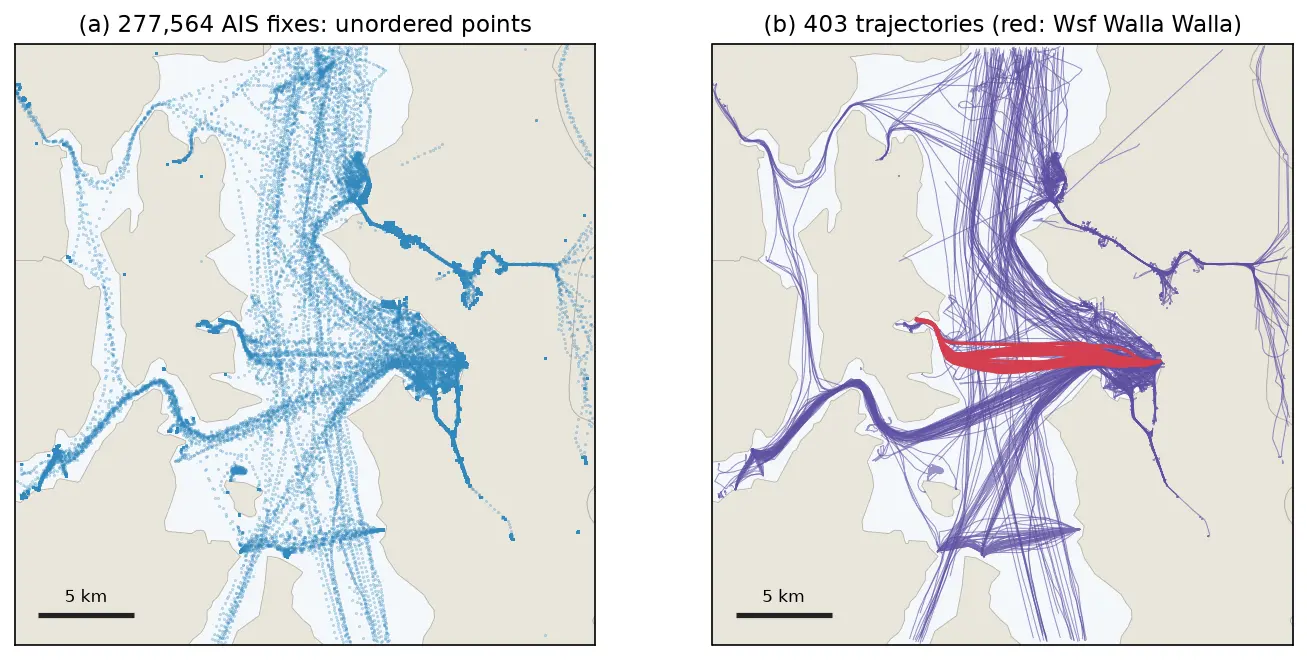
A MovingPandas tutorial on one day of real AIS vessel tracks in Puget Sound: 277,574 GPS fixes from 703 vessels turned into trajectories, with speed and direction, outlier cleaning, stop detection at ferry terminals, splitting into 148 trips, Douglas-Peucker against time-aware generalisation, a flow map of 319 aggregated flows, and reading and writing GPX.

Intermediate 14 min read

Tutorial Python

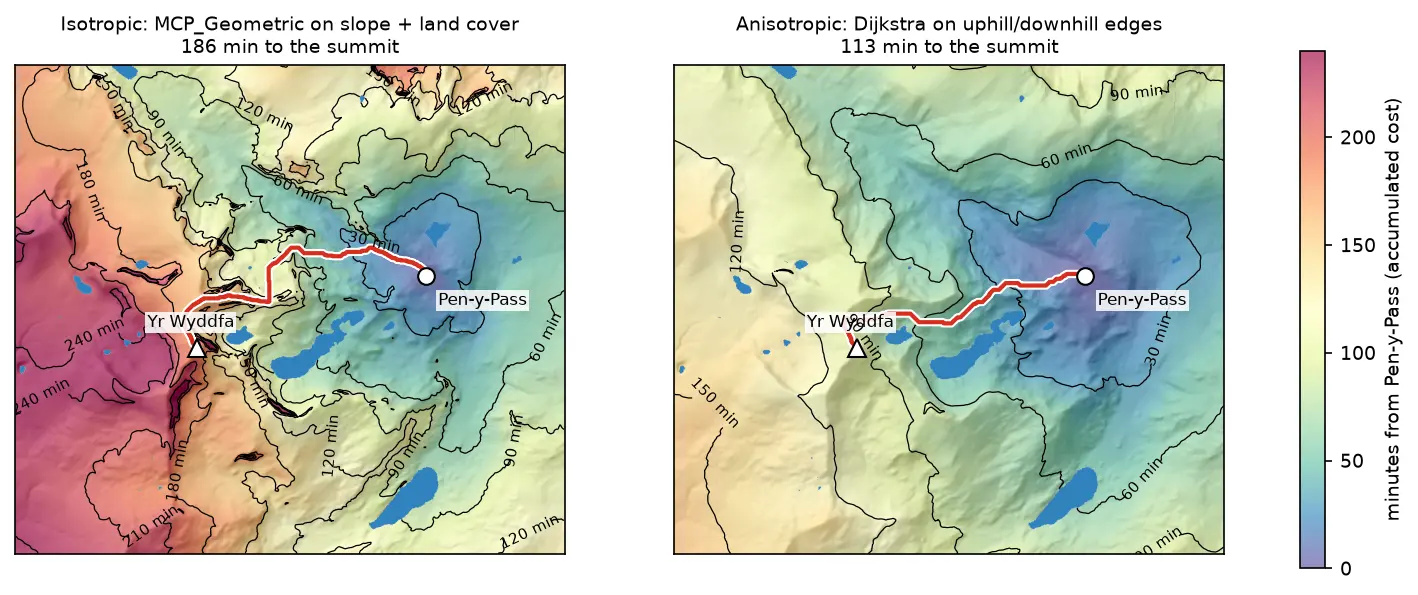
Least-cost path analysis in Python: cost surfaces and walking routes up Yr Wyddfa

Build a walking cost surface from real slope (Copernicus GLO-30) and land cover (ESA WorldCover), compute the accumulated cost surface and the least-cost path with scikit-image's MCP_Geometric, add a direction-aware Dijkstra version with SciPy, and compare the routes with the straight line and the OpenStreetMap footpaths from Pen-y-Pass to the summit of Yr Wyddfa (Snowdon).

Intermediate 14 min read

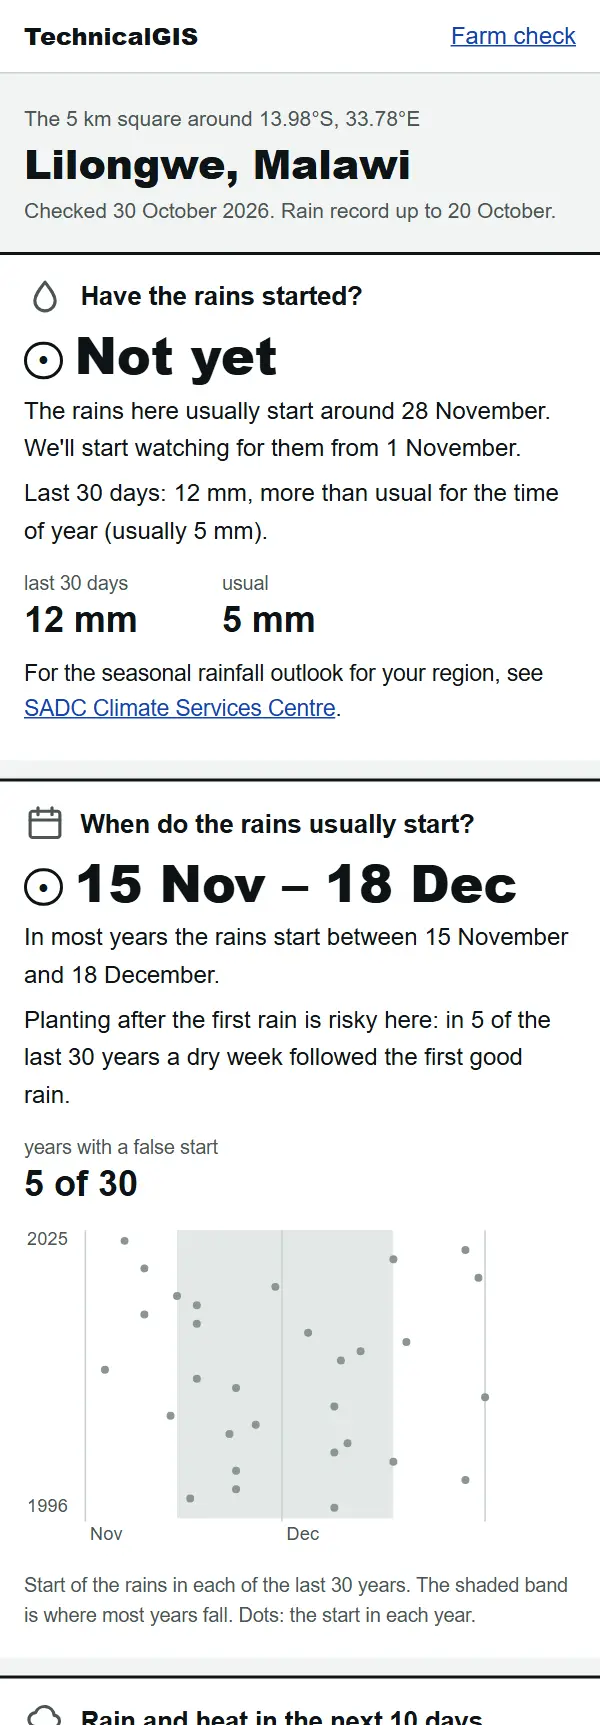
Farm check answer for Lilongwe, Malawi, on 30 October 2026: the rains have not started yet and usually start between 15 November and 18 December

Article Remote Sensing

Farm check: has the rain started on your farm?

A free, phone-friendly check for any farm: whether the rains have started, when they usually start, rain and heat for the next 10 days and how green the crops are. Examples from Lilongwe, Malawi, and Gazipur, Bangladesh.

Beginner 5 min read

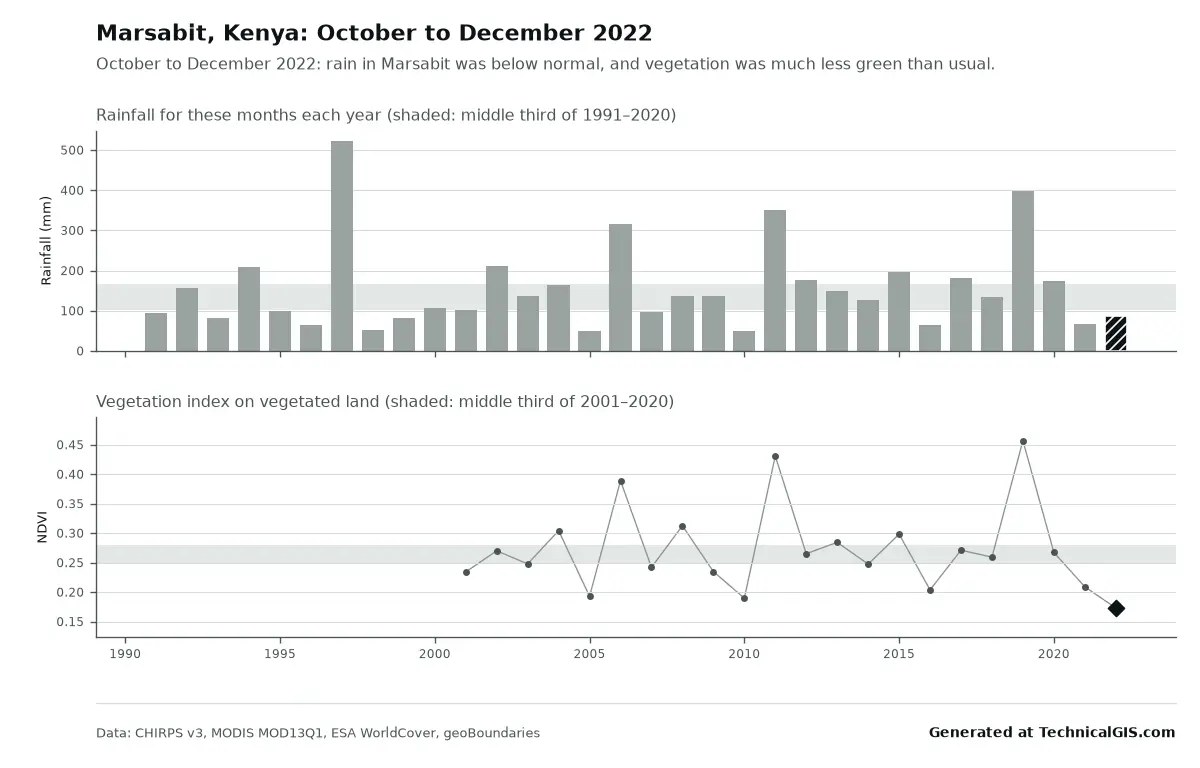
Season condition answer for Marsabit, Kenya, October to December 2022, with rainfall below normal and vegetation the lowest since 2001

Article Remote Sensing

Free community tools: season condition and flood impact for any district

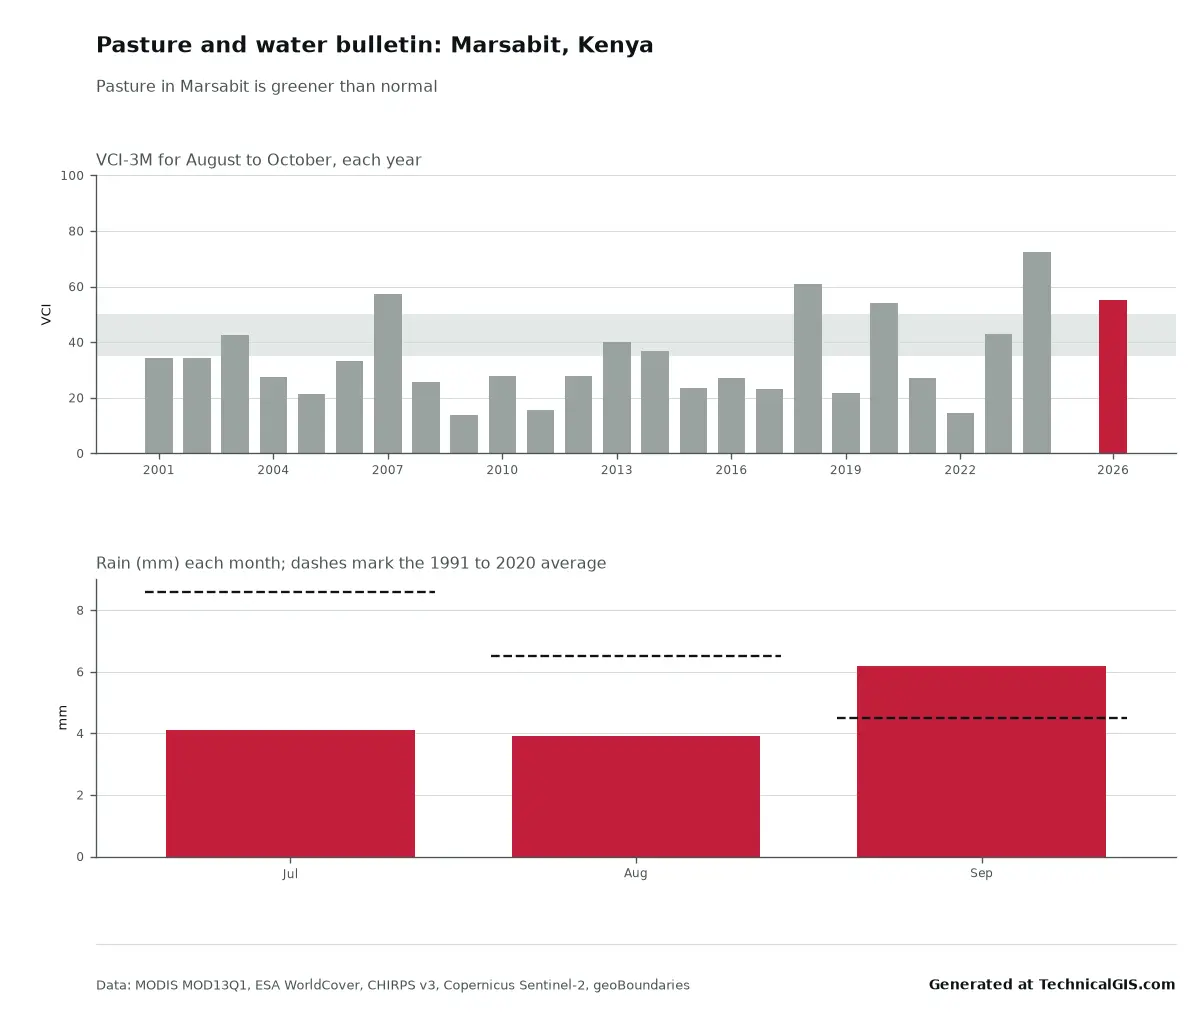
Two free tools for any district: is this season's rain and crop growth better or worse than usual, and where did it flood and how many people live there? Worked examples from Marsabit, Kenya, in 2022 and Feni, Bangladesh, in 2024.

Beginner 5 min read

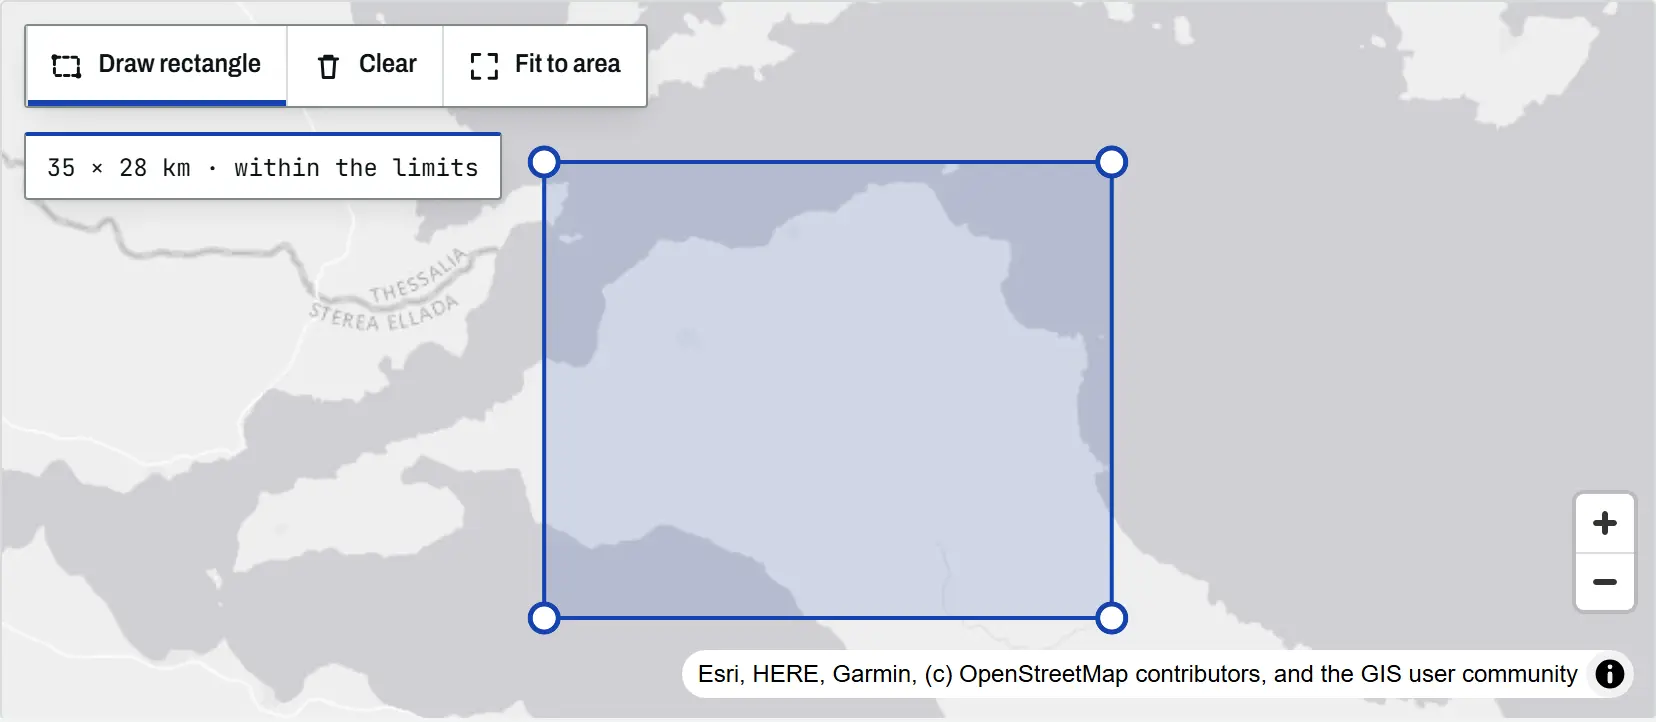
The climate tool map with a rectangle drawn over north Evia, Greece, its corner handles visible and a readout of 35 by 28 km within the limits

Article Remote Sensing

Climate time-series tools: charts and time-lapses for any place

An introduction to the TechnicalGIS climate time-series tools: five open datasets, how to draw an area on the map, worked examples from London, north Evia, Nairobi and Las Vegas, the processing limits and the terms for reusing every output.

Beginner 8 min read

Tutorial Python

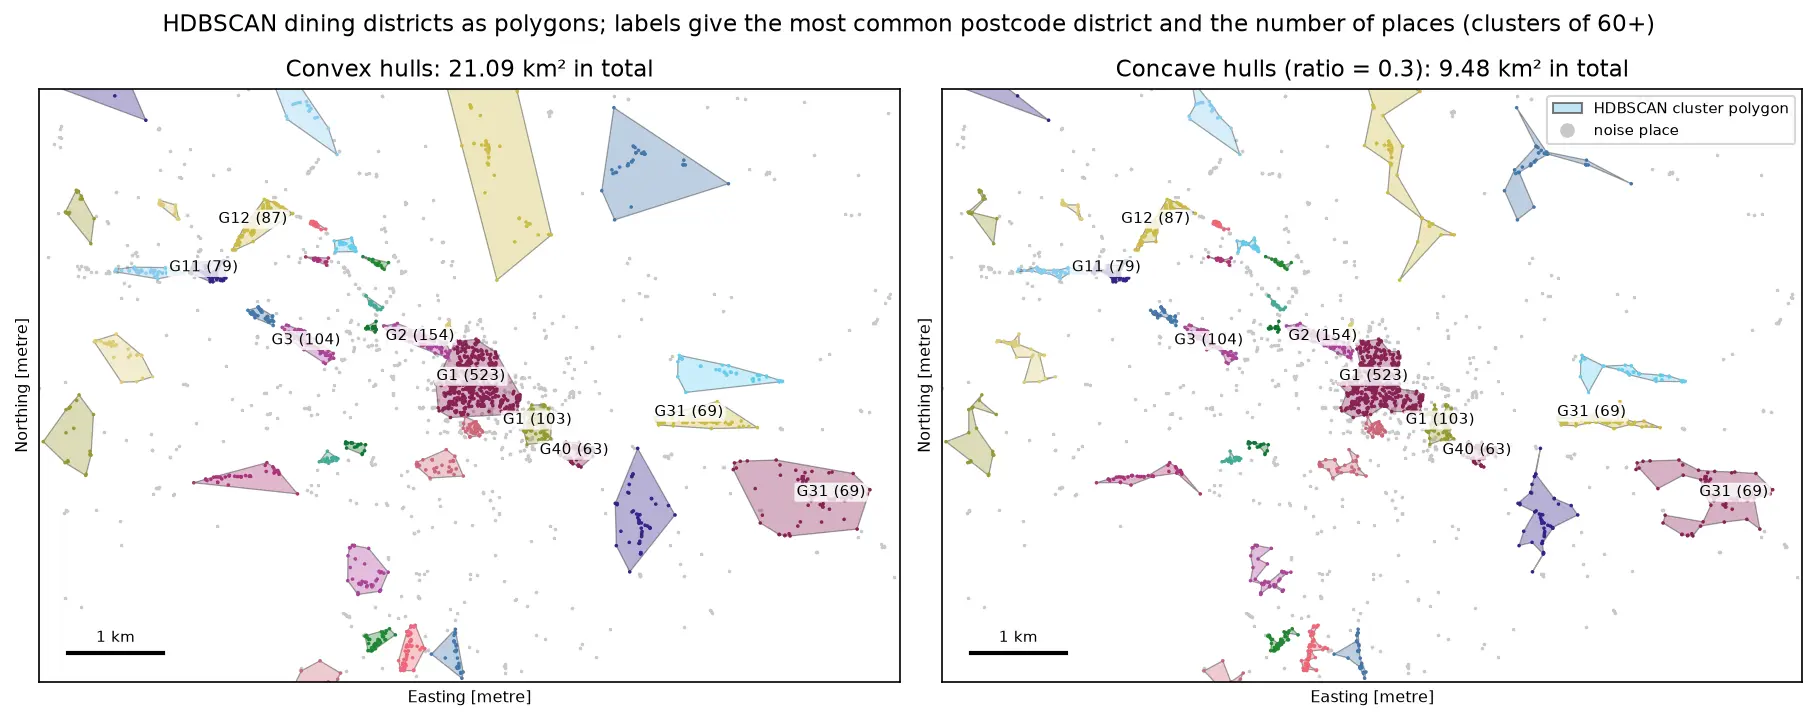
DBSCAN and HDBSCAN spatial clustering in Python: finding Glasgow's dining districts

Cluster GPS and point-of-interest data in Python with DBSCAN and HDBSCAN: use the haversine metric on latitude and longitude or plain metres on a projected grid, choose eps with a k-distance plot, handle variable density with HDBSCAN, draw convex and concave hull polygons, treat noise properly, read silhouette and DBCV with care, and scale up with a BallTree. Uses 3,950 real Overture Maps restaurants, cafés and bars in Glasgow.

Intermediate 18 min read

Tutorial Python

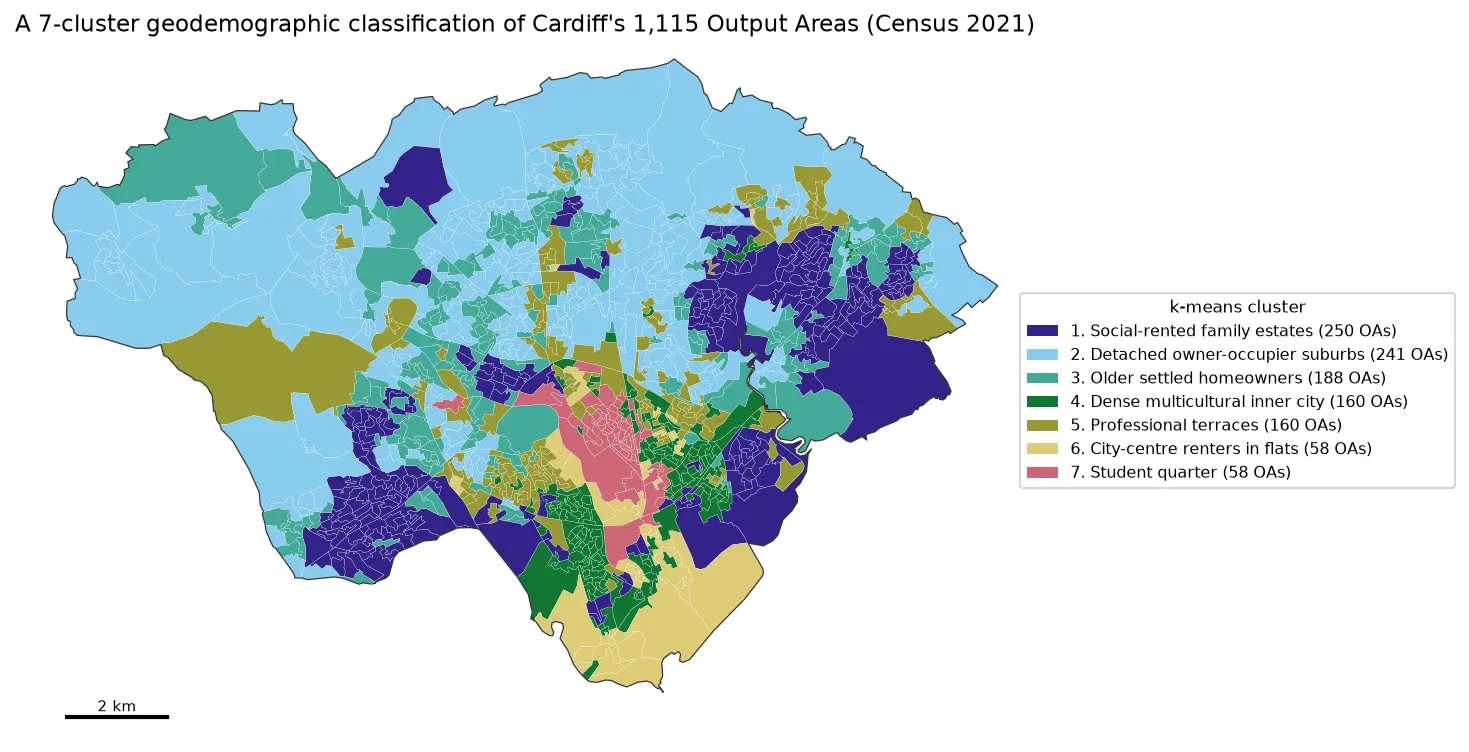
Geodemographic classification in Python: k-means on Census 2021 Output Areas, and SKATER and max-p regionalisation

Build a small geodemographic classification of Cardiff's 1,115 Census 2021 Output Areas in Python: choose and transform variables from Nomis bulk tables, standardise them, check correlations, choose k for k-means with the elbow, silhouette and stability across seeds, profile and cautiously name the clusters with index scores and radar charts, compare the result with the official 2021/2 OAC, test the MAUP at LSOA level, and contrast it with contiguous regions from spopt's SKATER and max-p.

Intermediate 17 min read

Tutorial Spatial Analysis Part 2 of 2

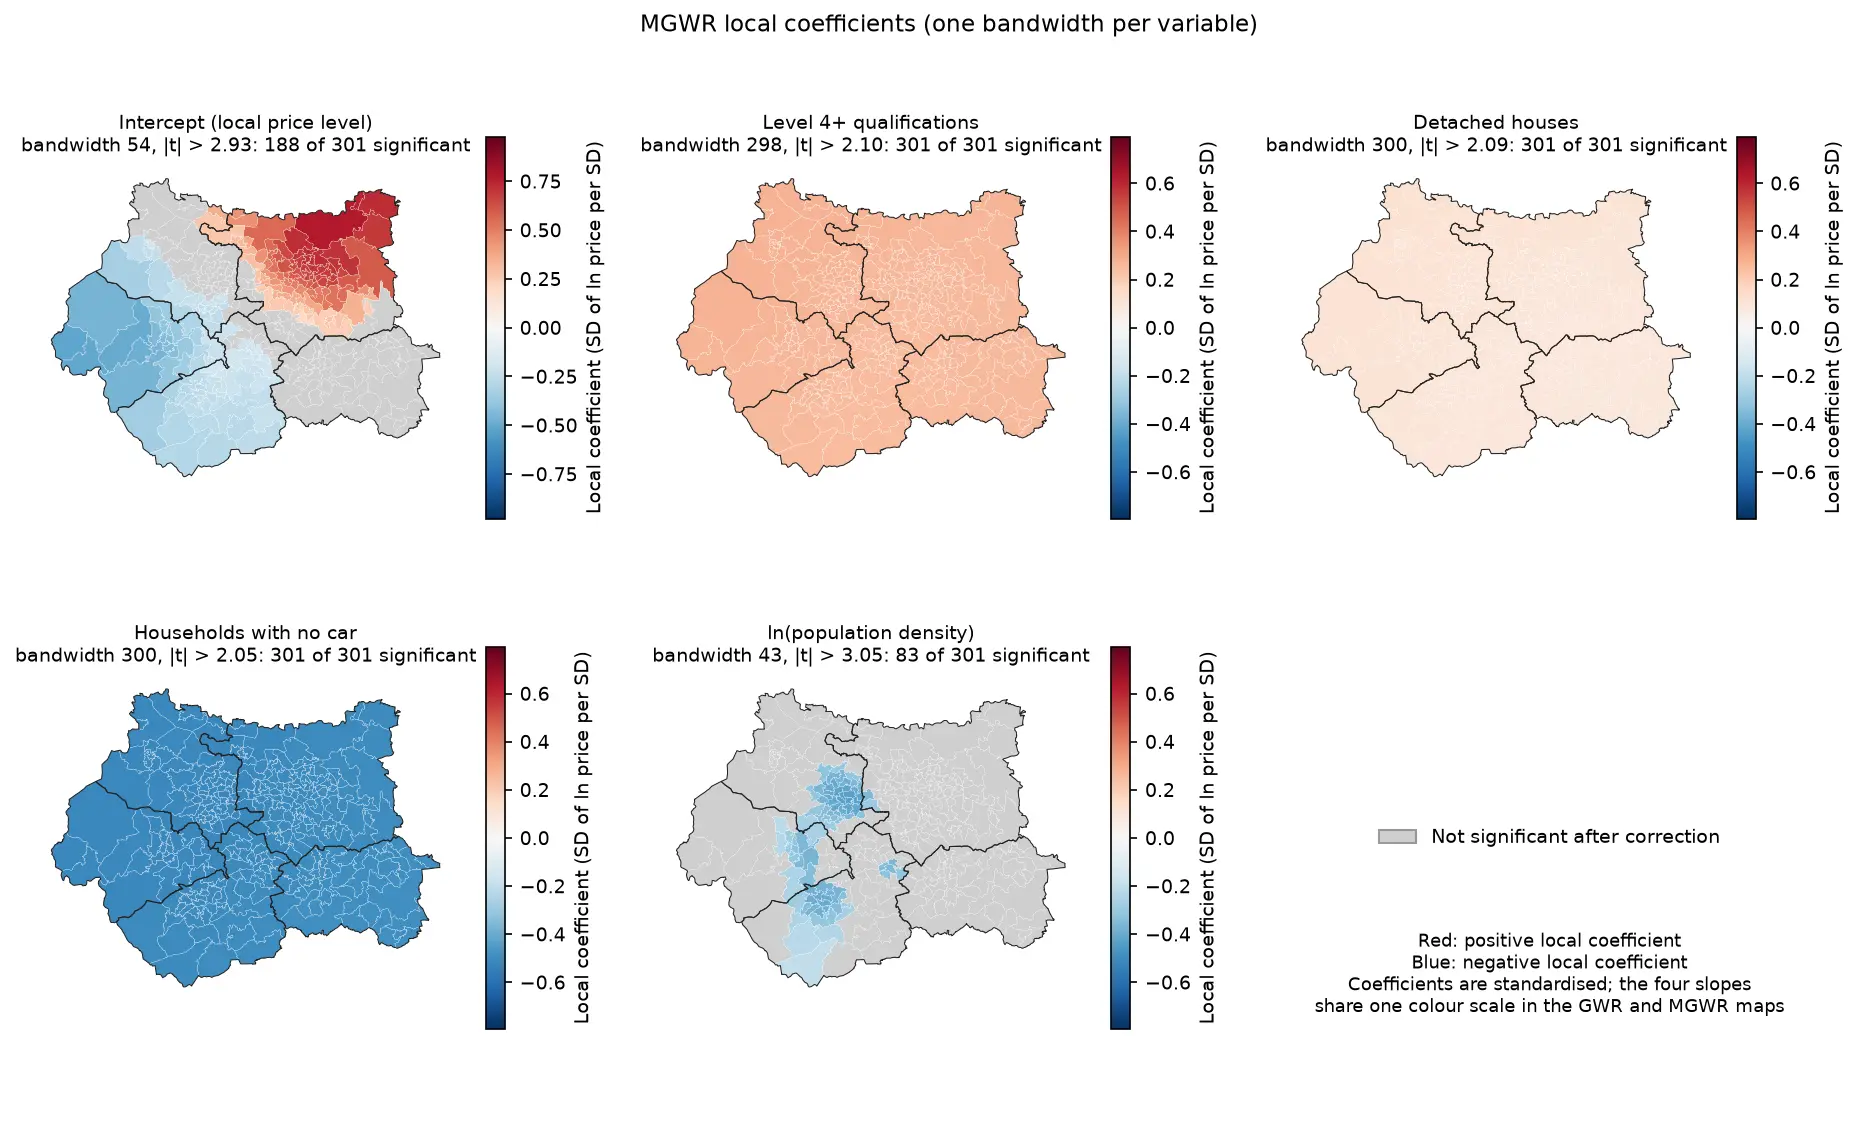
Geographically weighted regression in Python: GWR and MGWR with mgwr

Fit geographically weighted regression (GWR) and multiscale GWR (MGWR) in Python with the mgwr package on real West Yorkshire house prices: choose the bandwidth by AICc, map local coefficients with a multiple-testing correction, read local R² and local collinearity, and compare against global OLS, spatial lag and spatial error models.

Advanced 17 min read

Tutorial Python Part 2 of 2

Kernel density estimation in Python for GIS: bandwidths, GeoTIFF heatmaps and relative risk

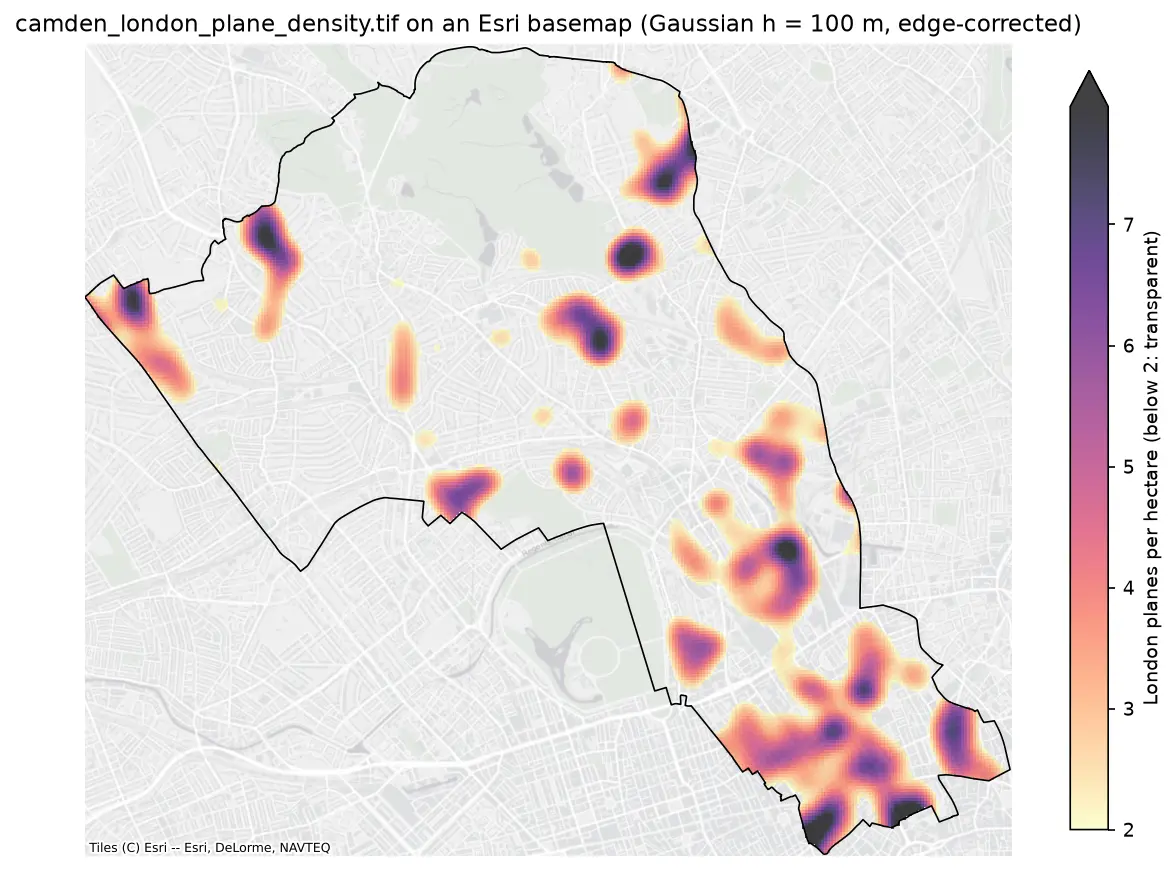
Make a kernel density heatmap from points in Python: compare Scott/Silverman, likelihood cross-validation and a fixed planning distance, Gaussian and Epanechnikov kernels and sample weights, export an edge-corrected GeoTIFF with rasterio, show it on a basemap, and map case-control relative risk on Camden's London plane trees.

Intermediate 16 min read

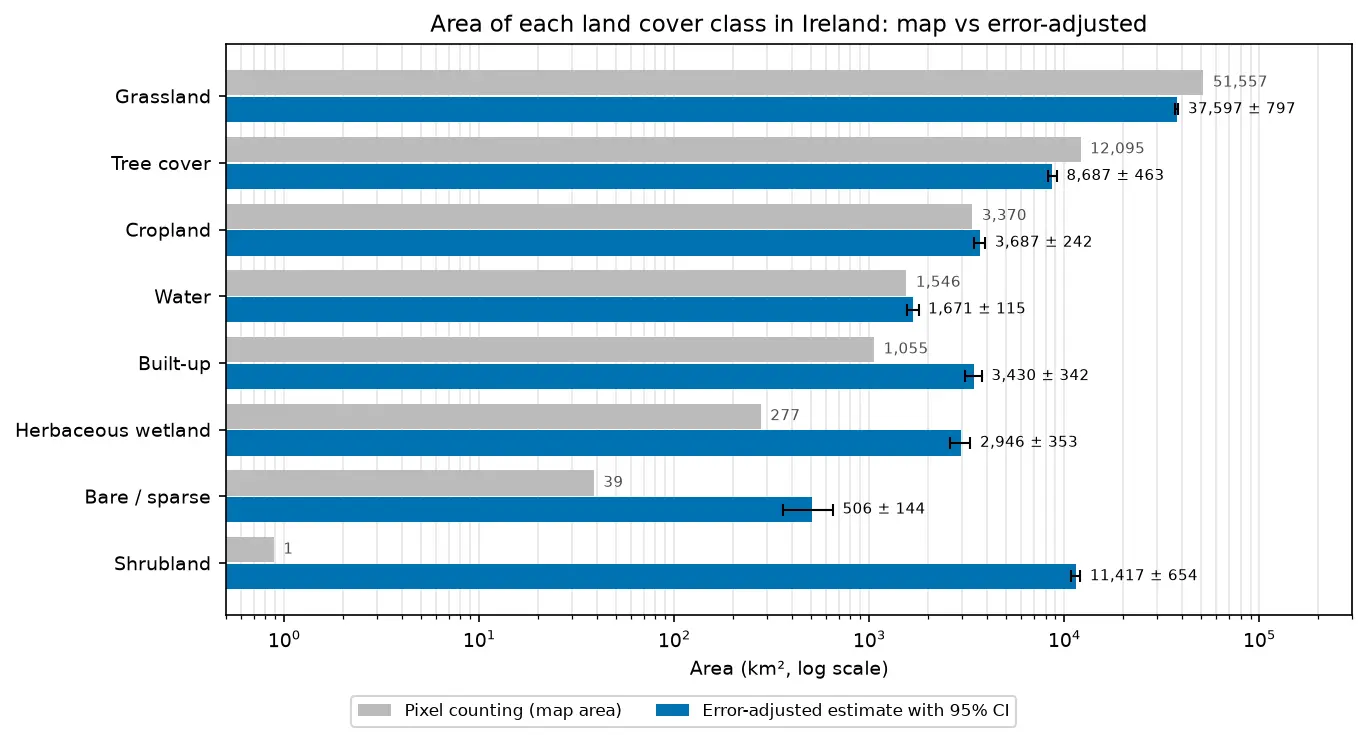
Bar chart comparing the area of each land cover class in Ireland from WorldCover pixel counting with the error-adjusted estimate and its 95% confidence interval.

Tutorial Remote Sensing

Land cover accuracy assessment in Python: confusion matrix, Olofsson area estimates and sample size

Assess a real land cover map in Python: ESA WorldCover 2021 against 8,597 Eurostat LUCAS 2022 field survey points in Ireland. Build the confusion matrix, compute overall, user's and producer's accuracy, see why kappa is discouraged, and use the Olofsson et al. (2014) stratified estimators to get error-adjusted areas with 95% confidence intervals and to plan a new stratified random sample.

Advanced 20 min read

Tutorial Python Part 2 of 2

Location-allocation in Python: p-median, p-center and maximal covering (MCLP) with spopt

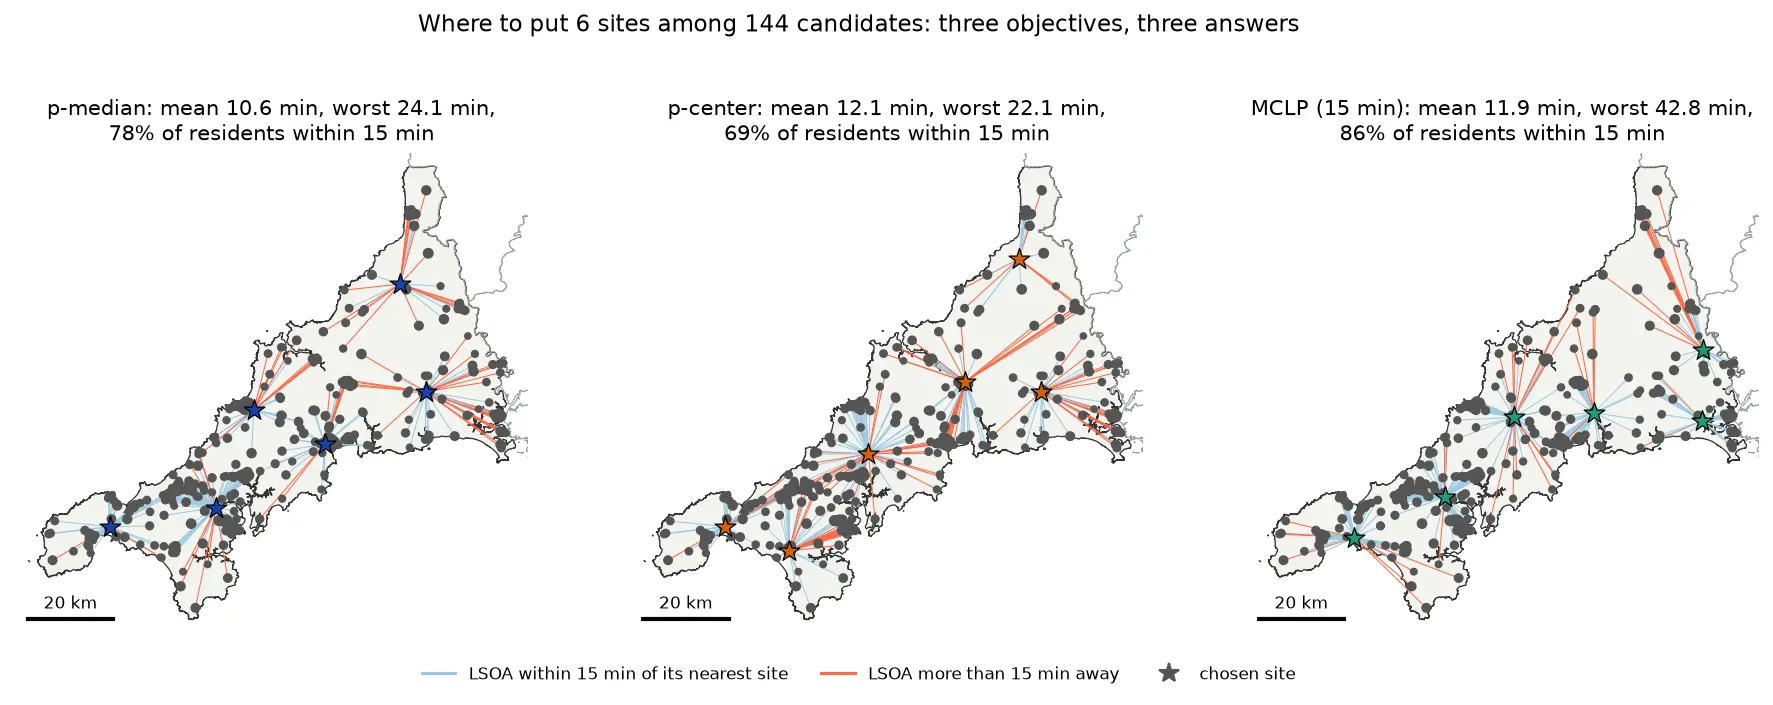
Solve location-allocation problems in Python with spopt and the CBC solver: the p-median, p-center and maximal covering location problem (MCLP). Choose sites for new urgent-care or mobile clinic bases among Cornwall's community buildings, on OSMnx drive times and Census 2021 population, compare the three answers on maps and charts, draw the trade-off curve as the number of sites grows, and see how problem size drives solve time.

Intermediate 17 min read

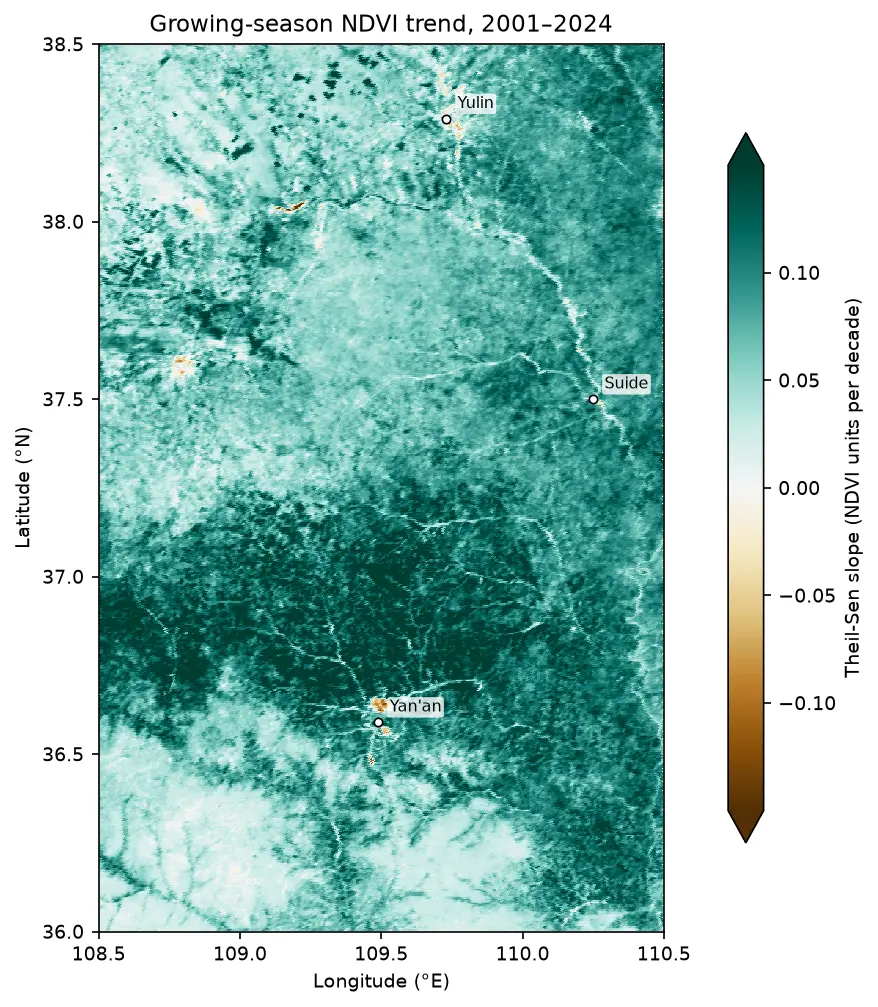
Map of the Theil-Sen slope of growing-season NDVI from 2001 to 2024 on the Loess Plateau between Yan'an and Yulin, almost entirely teal (greening), with a few brown browning patches near Yan'an and Yulin.

Tutorial Remote Sensing

Mann-Kendall trend test on rasters in Python: Theil-Sen NDVI trends with xarray

Run a pixel-wise Mann-Kendall trend test and Theil-Sen slope on 24 years of MODIS NDVI in Python. Read MOD13A1 from the Microsoft Planetary Computer, mask it with the QA layer, aggregate to growing-season means, vectorise the tests with xarray.apply_ufunc (checked against pymannkendall), compare the seasonal and modified Mann-Kendall tests, control the false discovery rate across 229,229 pixels, and map greening and browning on China's Loess Plateau.

Advanced 16 min read

Tutorial Python Part 1 of 2

Two-step floating catchment area (2SFCA) in Python: spatial access to GP practices in Cornwall

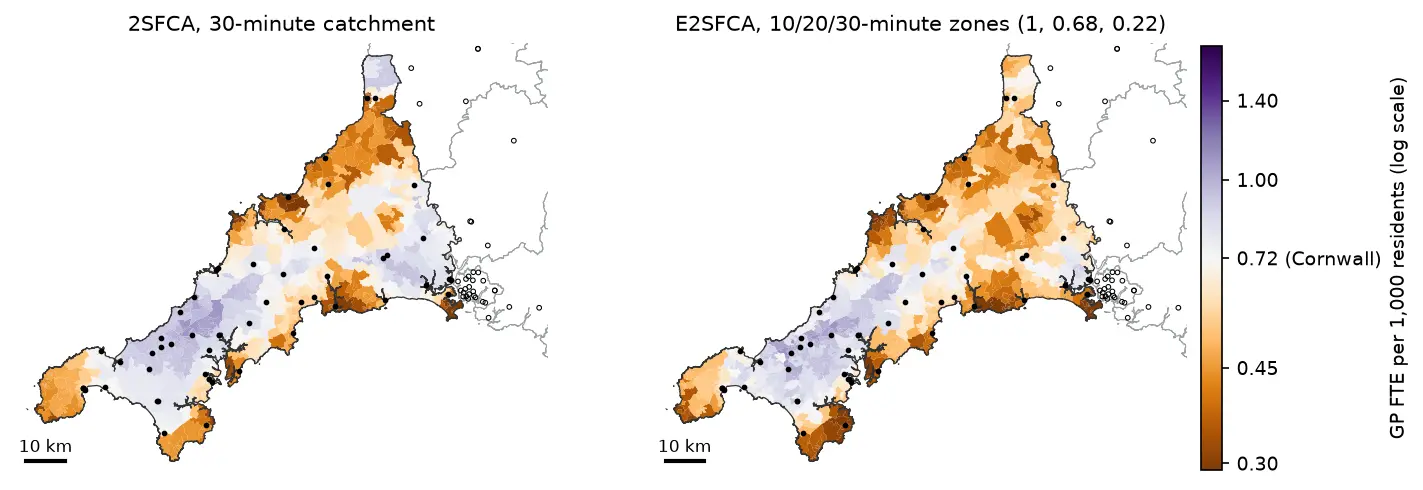
Measure spatial accessibility to GP practices in Python with the two-step floating catchment area (2SFCA) method and its distance-decay version (E2SFCA). Build OSMnx drive times for Cornwall from OpenStreetMap, use NHS GP workforce data and Census 2021 population, compare the PySAL access package with a vectorised NumPy version, and test the catchment threshold, the decay function and edge effects.

Intermediate 18 min read

Tutorial Spatial Analysis Part 1 of 2

Spatial regression in Python: OLS diagnostics, spatial lag and spatial error models with spreg

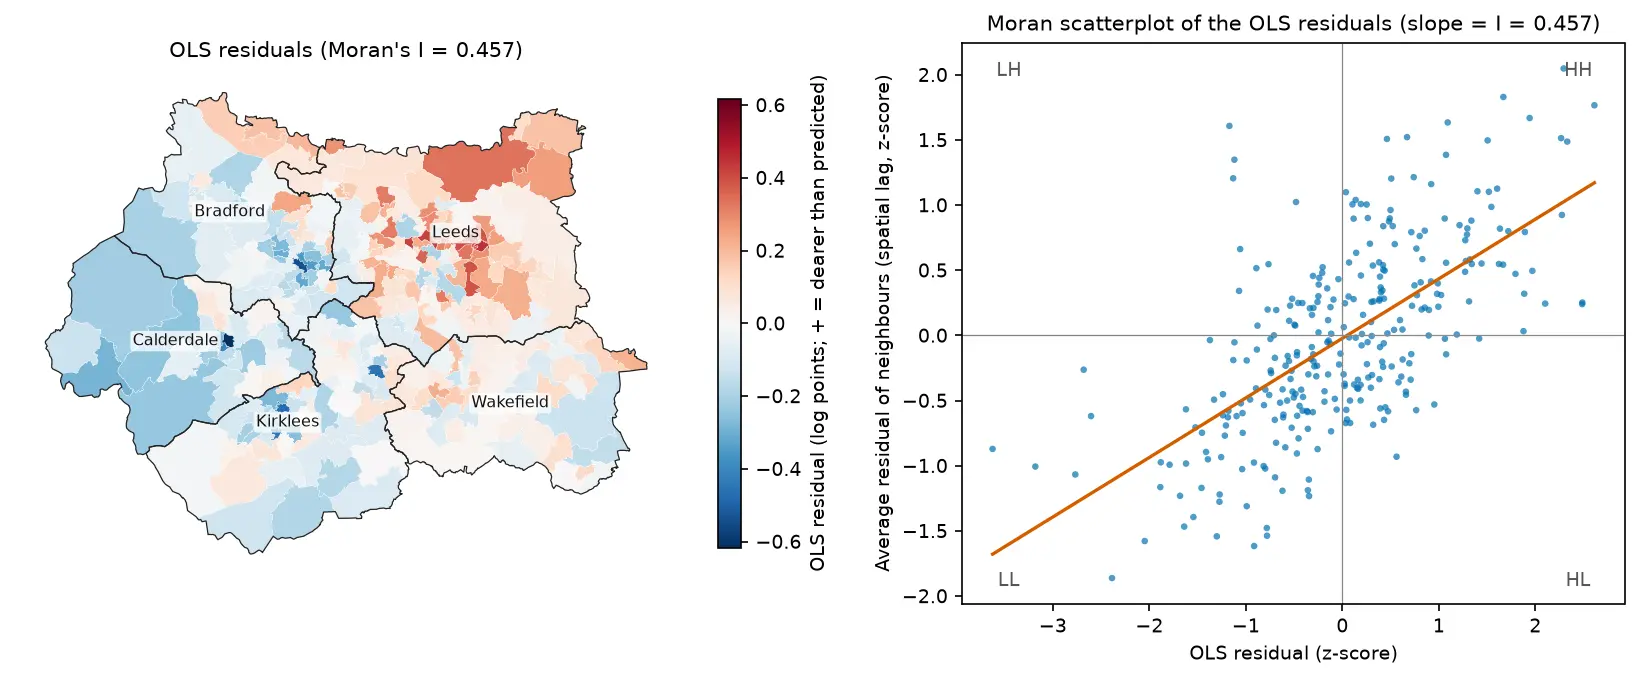
Fit spatial regression models in Python with PySAL's spreg on real West Yorkshire house prices: test the OLS residuals for spatial autocorrelation, read the Lagrange Multiplier diagnostics, fit spatial lag and spatial error models, compare them by AIC and log-likelihood, interpret direct, indirect and total impacts, and check how much the spatial weights matter.

Intermediate 18 min read

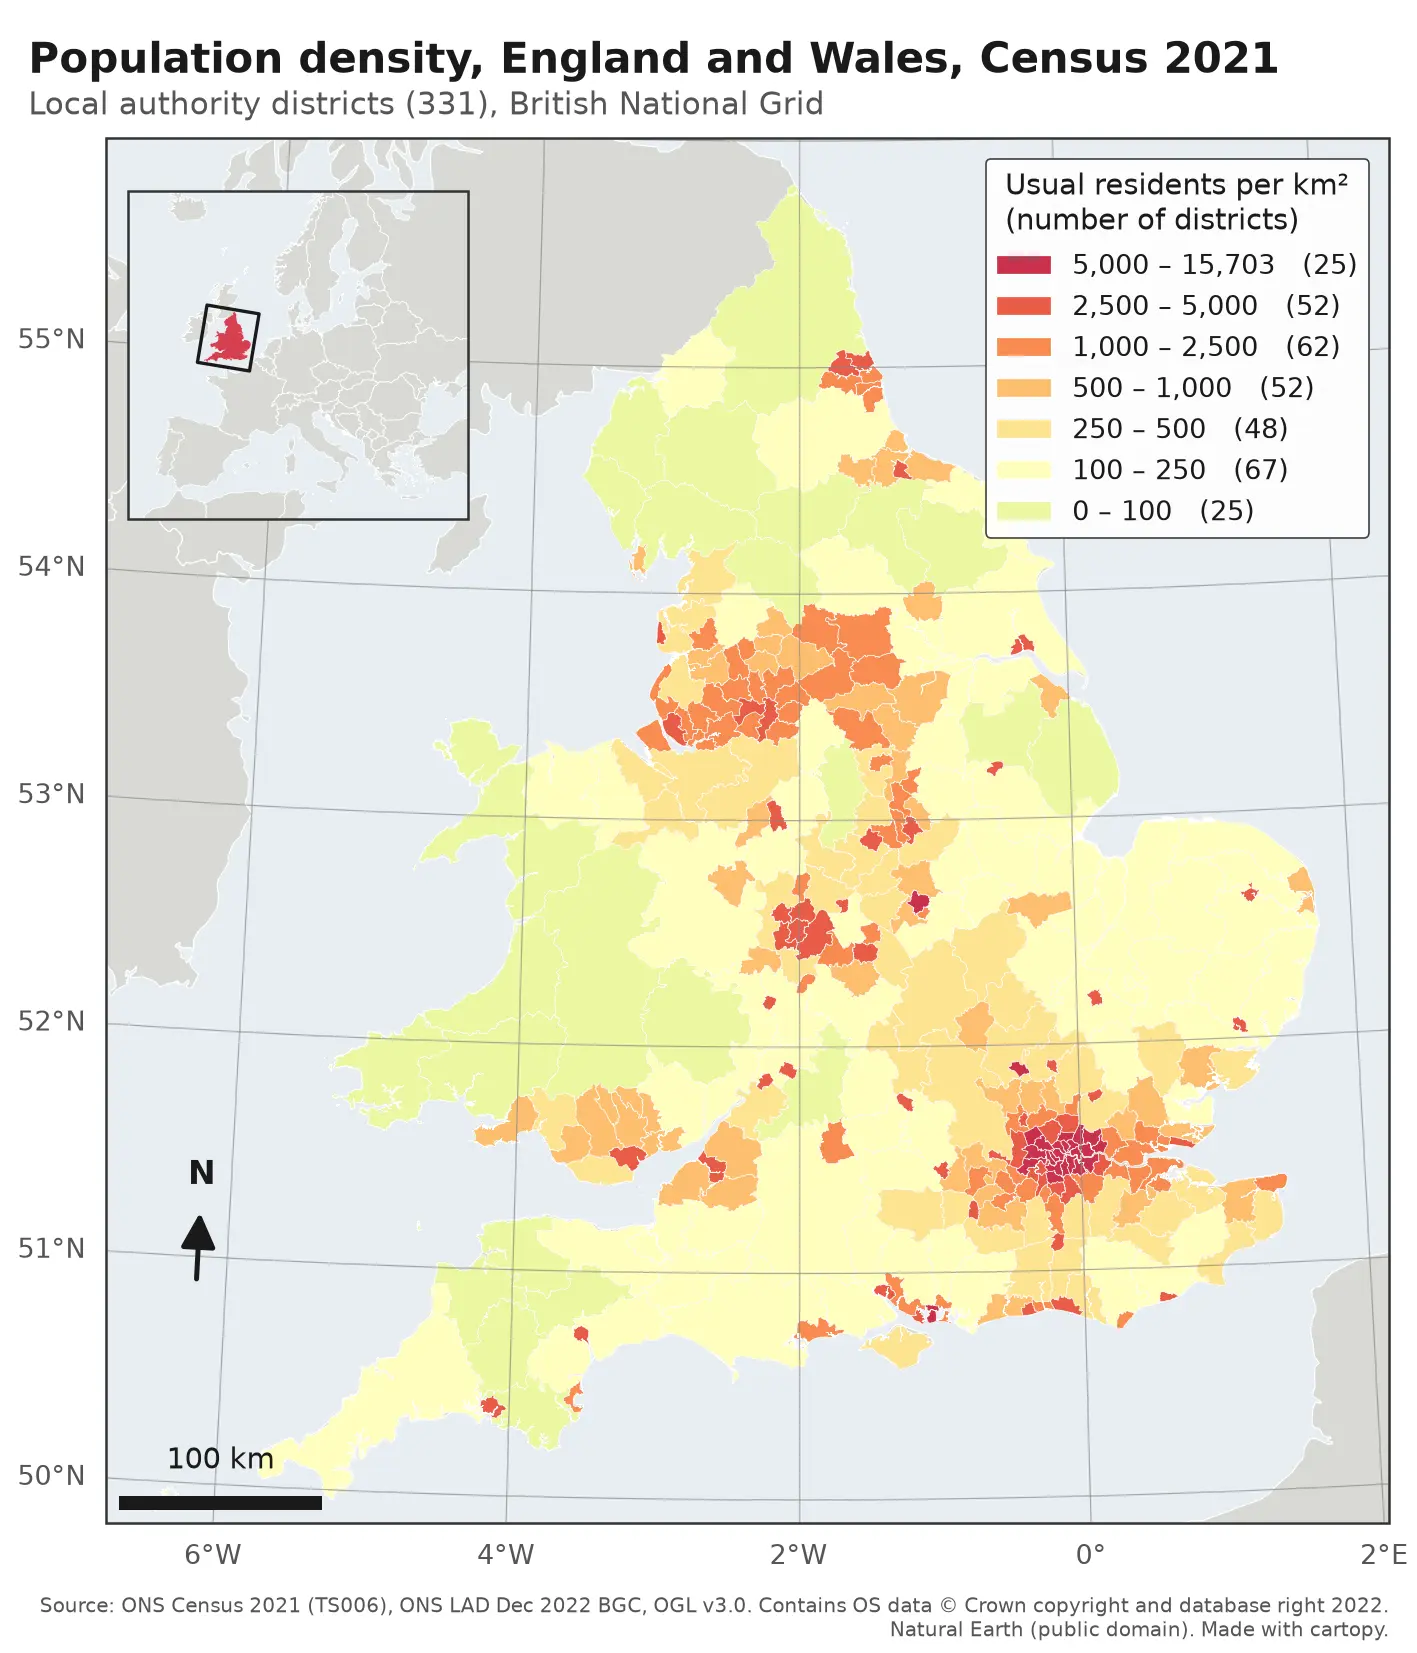
Choropleth map of population density in the 331 local authority districts of England and Wales from Census 2021, in seven classes from pale yellow (under 100 residents per km²) to deep red (over 5,000). London, Birmingham, Manchester, Liverpool, Leeds, Newcastle and the south coast cities stand out in red; Wales, Cumbria, Northumberland and Lincolnshire are pale. The map has a classified legend, a 100 km scale bar, a north arrow, latitude and longitude labels and an inset locator map of Europe.

Tutorial Python

Make a map in Python with matplotlib and cartopy: projections, classified choropleths, scale bars, north arrows and inset maps

A cartopy tutorial for publication-quality maps in Python: choose a projection, draw a classified choropleth of Census 2021 population density with a proper legend, add a scale bar, a true-north arrow, an inset locator map and gridlines, style it for light and dark backgrounds, export at 300 dpi to PNG, PDF and SVG, and shade the Copernicus DEM for Greater Manchester.

Beginner 14 min read

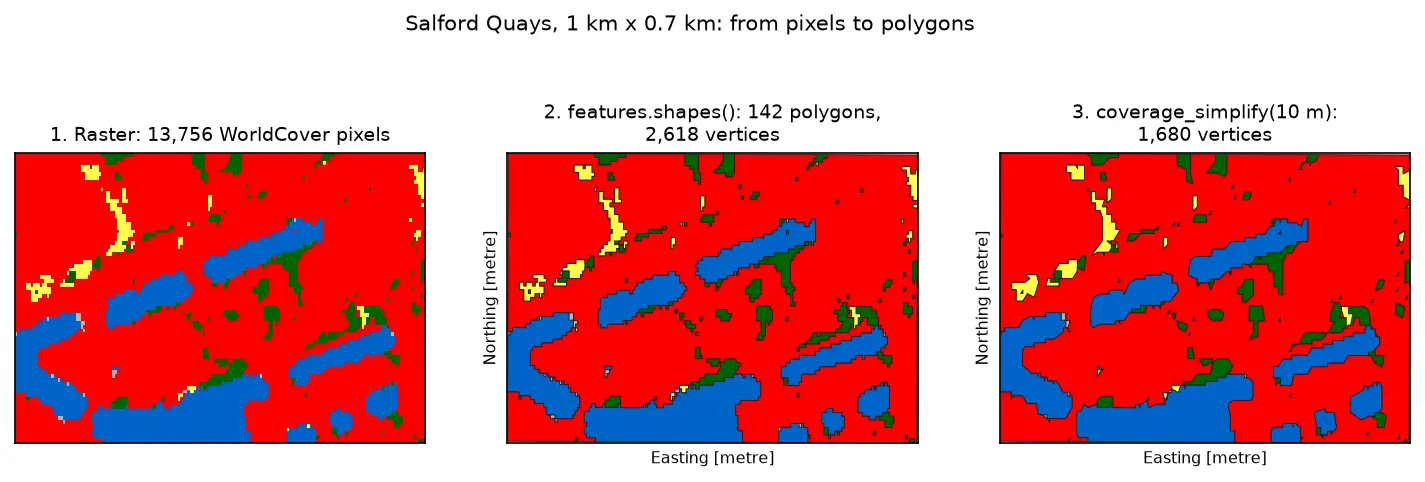
Three panels of the same 1 km by 0.7 km area at Salford Quays. Left: square WorldCover pixels, mostly red built-up land with blue dock basins and small green and yellow patches. Middle: the same area as 142 polygons with black outlines that follow the pixel staircase. Right: the polygons after coverage simplification at 10 m, with smoother outlines and no gaps between them.

Tutorial Python Part 3 of 3

Raster to vector in Python: polygonize with rasterio, rasterize boundaries and convert a GeoTIFF to a Cloud Optimized GeoTIFF

Convert raster to vector in Python with rasterio.features.shapes on 10 m ESA WorldCover for Greater Manchester: polygonize water and built-up land, fix invalid polygons, simplify without gaps, rasterize ONS district boundaries for land-cover shares, then write and validate a Cloud Optimized GeoTIFF with rio-cogeo and measure HTTP range reads.

Intermediate 14 min read

Tutorial Python

Rooftop solar potential from LiDAR in Python: pvlib, PVGIS and shading for every roof

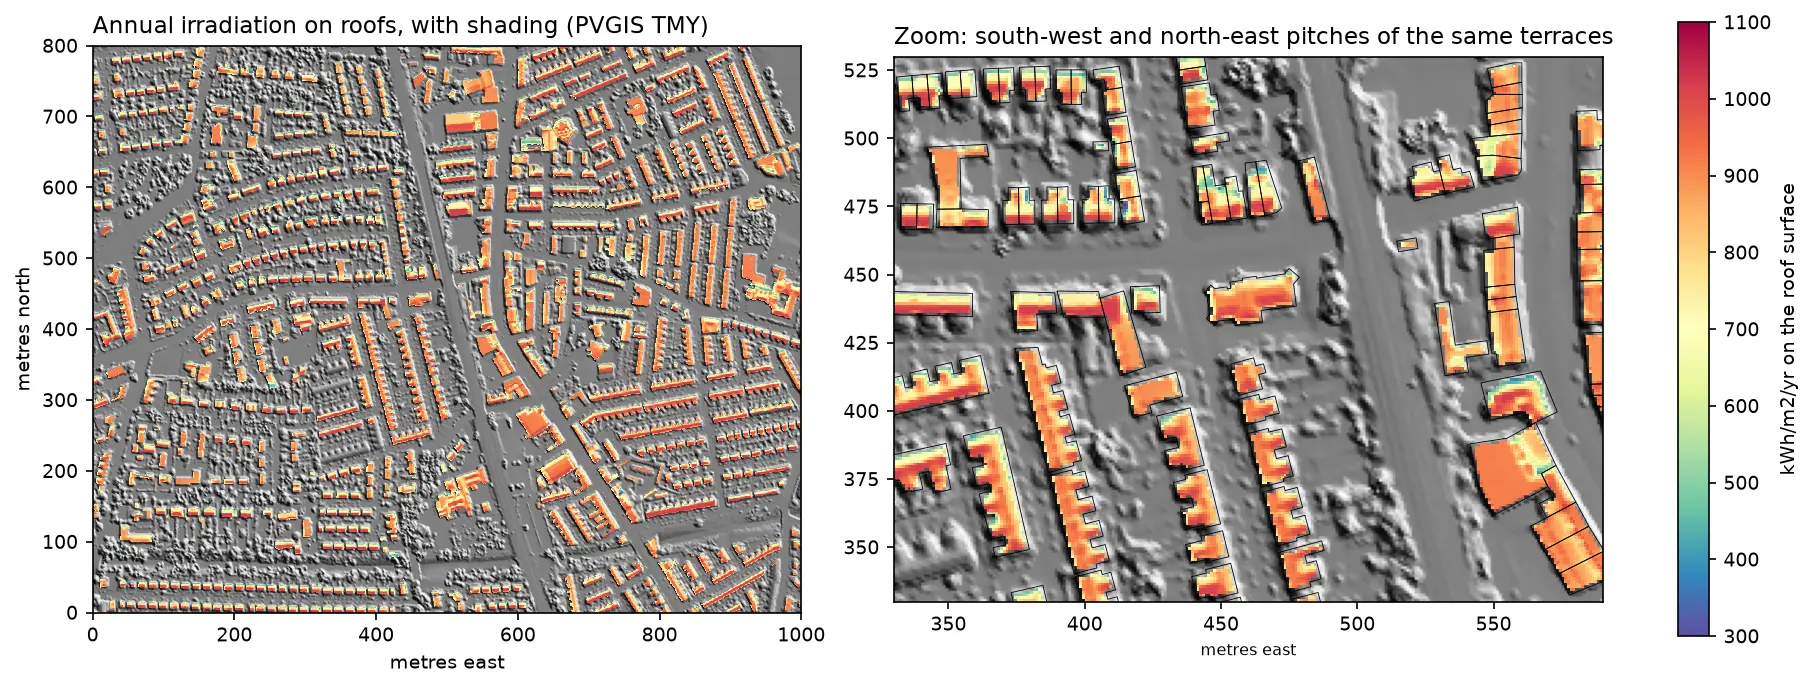
Estimate rooftop solar potential in Python for 2,148 buildings in Manchester: take a 1 m Environment Agency LiDAR DSM and Overture Maps footprints, compute roof slope and aspect, trace horizon angles for shading from neighbours and trees, build a sun map from a PVGIS typical year with pvlib, check it against pvlib's Perez model and PVGIS, then estimate kWp and kWh per year per roof and rank the best roofs.

Advanced 14 min read

Tutorial Python Part 2 of 3

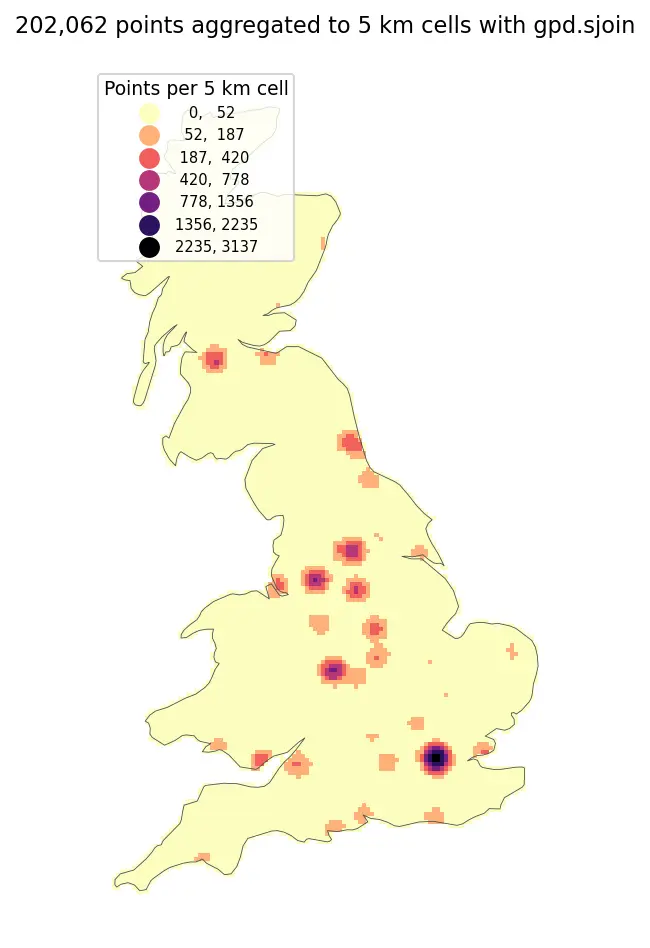
Spatial joins in GeoPandas: sjoin, predicates, sjoin_nearest and point in polygon

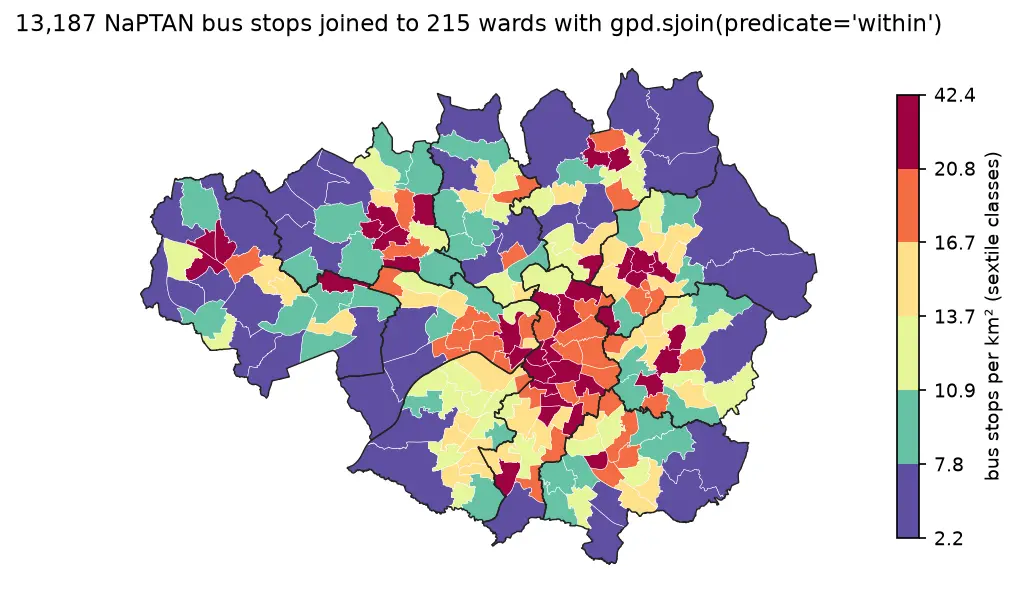
A practical guide to spatial joins in GeoPandas with real Greater Manchester data: 13,187 NaPTAN bus stops, 1,386 OpenStreetMap schools, 215 ONS wards and 1,702 LSOAs. Covers point in polygon with sjoin, predicates, counts per polygon, how='left'/'inner'/'right', sjoin_nearest with max_distance, clip and overlay, and a timing comparison of a naive loop against the spatial index.

Beginner 12 min read

Tutorial Python Part 1 of 3

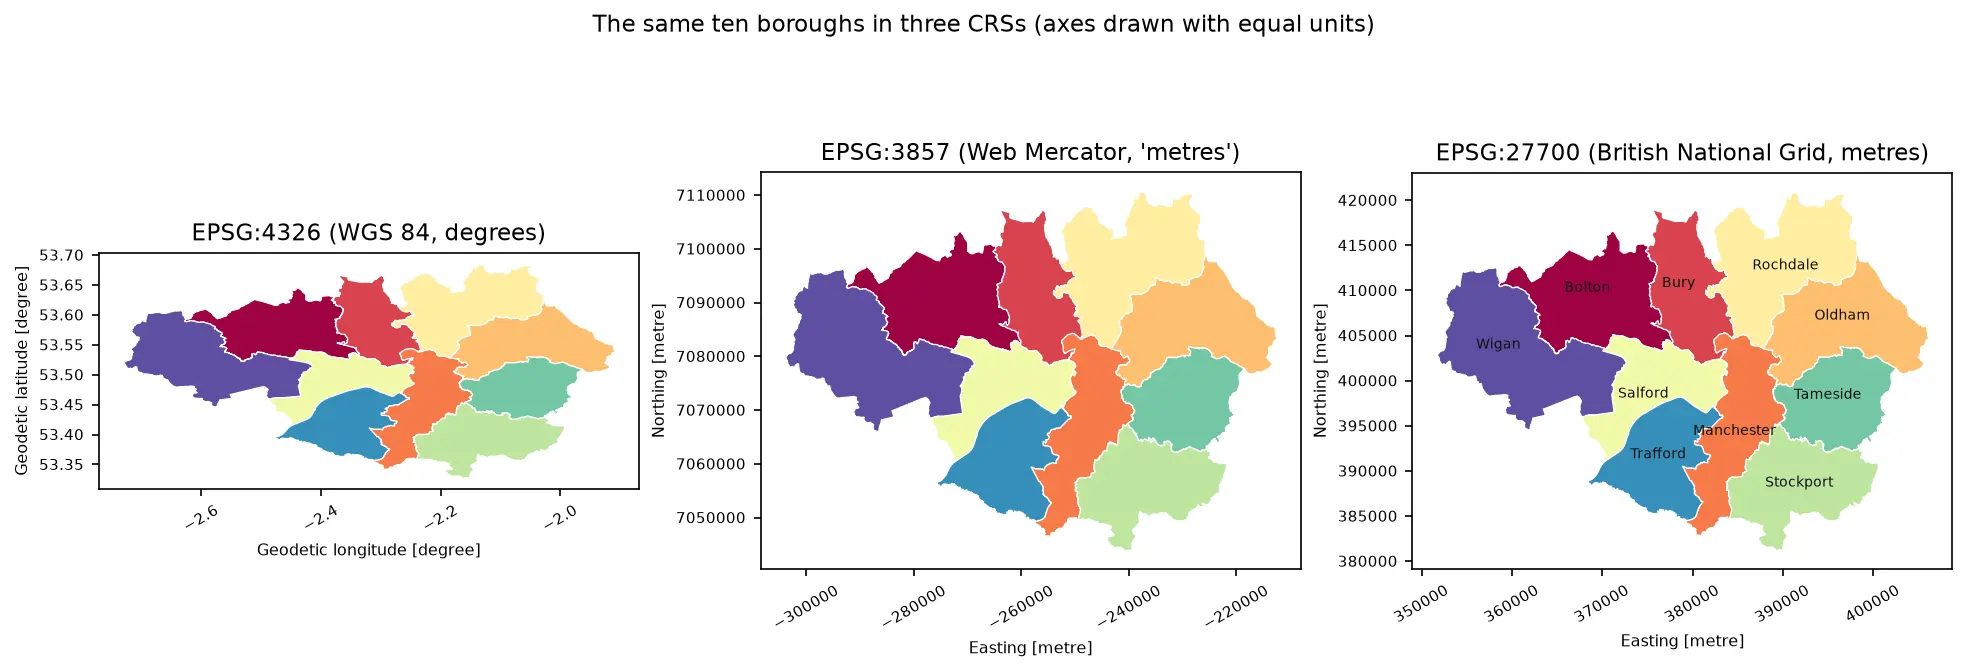
Coordinate reference systems in Python: EPSG codes, pyproj transforms and reprojecting vectors and rasters

A practical guide to coordinate reference systems in Python with pyproj, GeoPandas and rasterio, tested on real Greater Manchester data. Covers EPSG codes, WGS 84 vs British National Grid (EPSG:27700), the always_xy axis-order trap, OSTN15 vs Helmert datum shifts checked against 13,187 NaPTAN bus stops, measured area and distance errors in the wrong CRS, and reprojecting a GeoDataFrame and a Copernicus DEM raster.

Beginner 13 min read

Tutorial Python

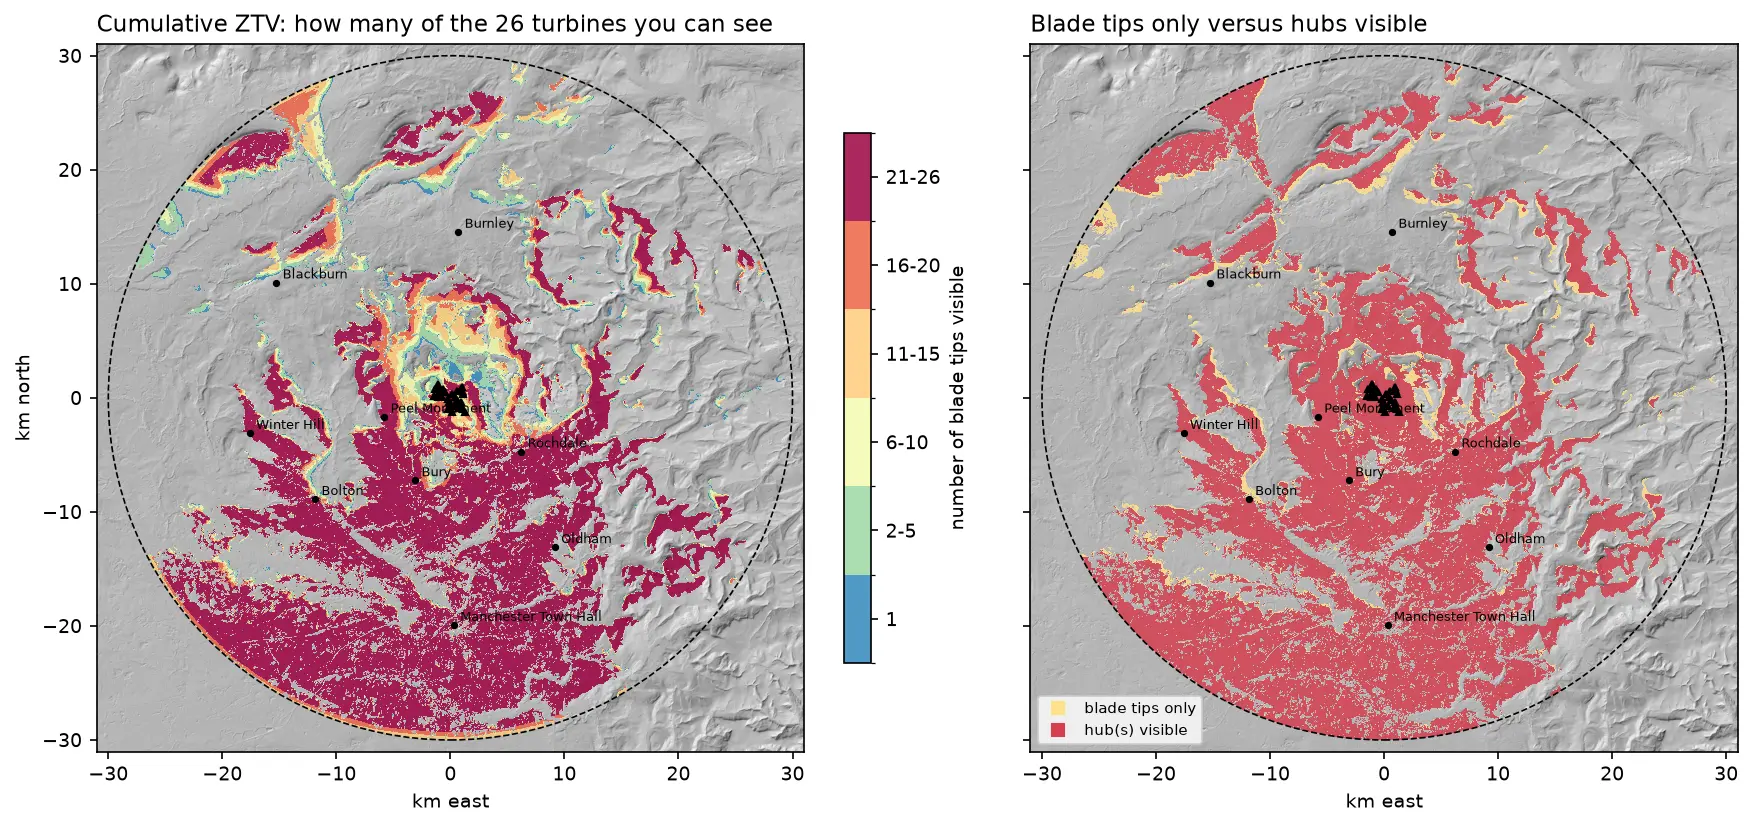
Viewshed analysis in Python: line of sight and a wind farm ZTV with GDAL and numpy

Run a viewshed analysis in Python on a real DEM: compute what one wind turbine can see with gdal.ViewshedGenerate, rebuild the same line-of-sight algorithm in numpy, correct for earth curvature and refraction, build a cumulative zone of theoretical visibility (ZTV) from 26 turbines, draw line-of-sight profiles, and measure how much trees and buildings in a LiDAR DSM shrink a bare-earth viewshed.

Intermediate 16 min read

Tutorial Python

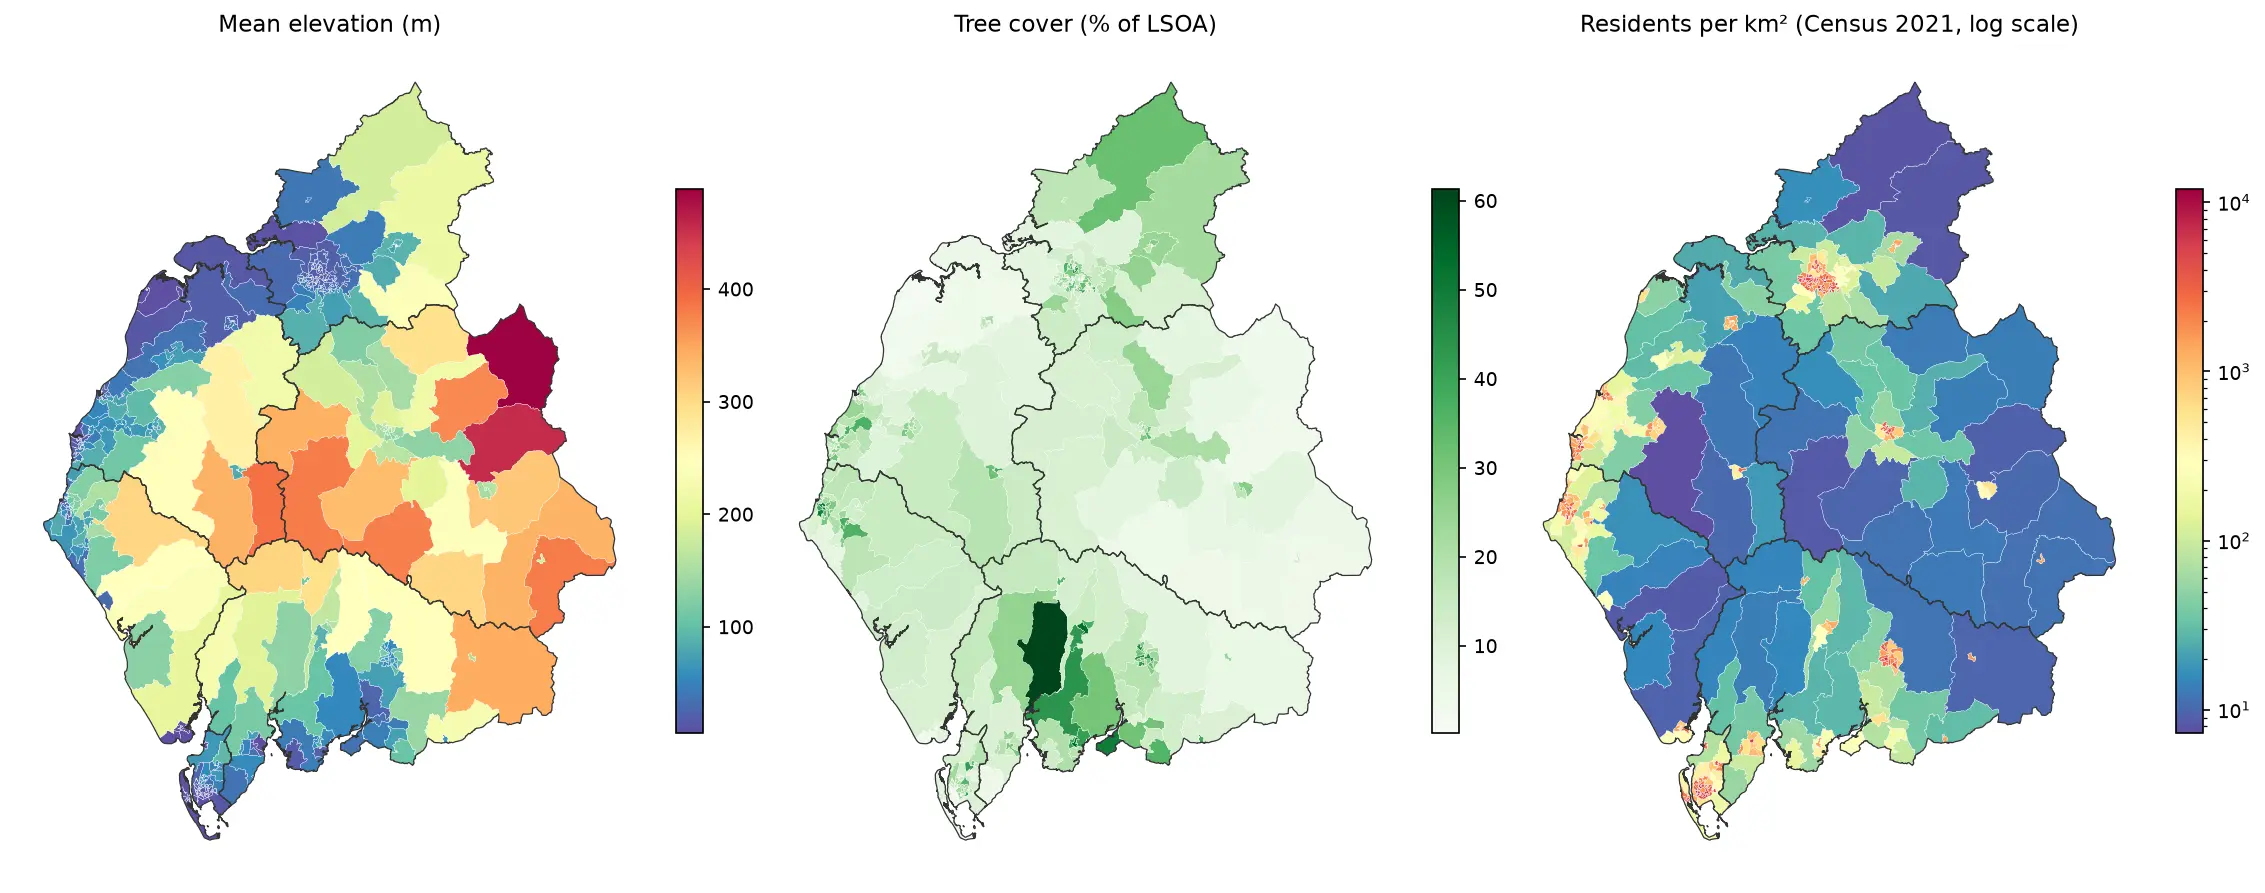
Zonal statistics in Python: exactextract vs rasterstats, with partial pixels, land-cover fractions and a benchmark

Calculate zonal statistics in Python with exactextract and rasterstats on real data: ONS 2021 LSOA boundaries for Cumbria with GHSL population, the Copernicus DEM and ESA WorldCover. Covers partial-pixel weighting vs pixel centroids, CRS alignment, categorical land-cover fractions, a speed benchmark, GeoPackage export and choropleth maps.

Intermediate 14 min read

Tutorial Python

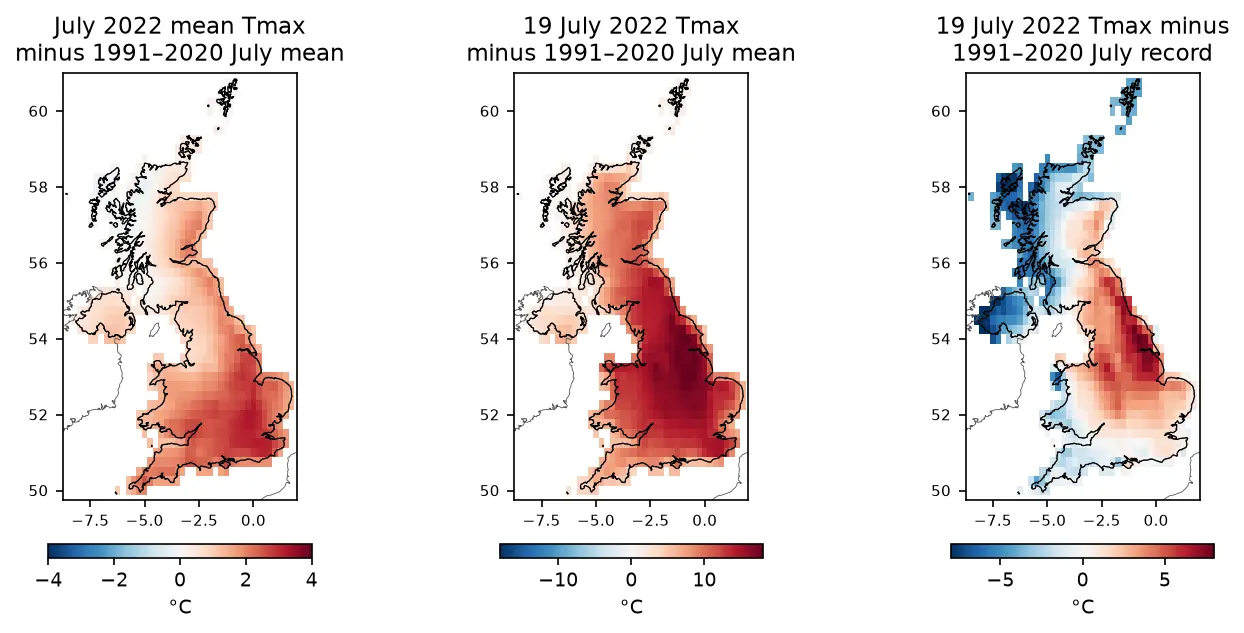
ERA5 in Python with xarray: mapping the July 2022 UK heatwave

Read ERA5 climate reanalysis in Python with xarray from free, login-free cloud Zarr stores, clip it to the UK, compute area-weighted means and anomalies against 1991–2020, export a Cloud Optimised GeoTIFF and check it against Met Office stations.

Intermediate 13 min read

Tutorial Python

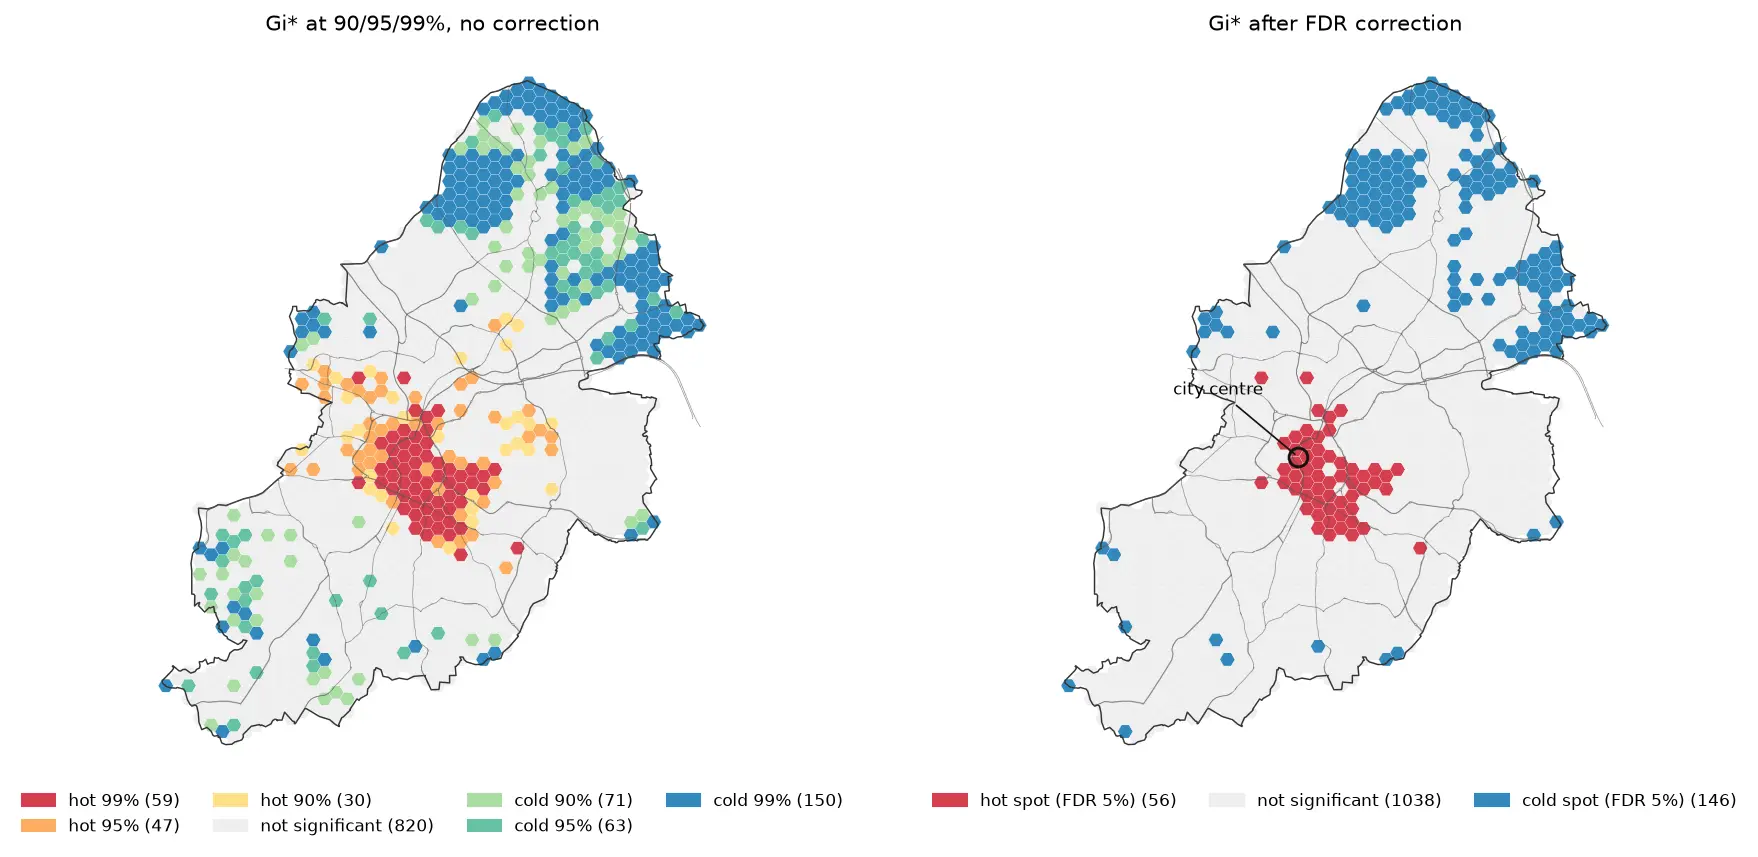
Hot spot analysis in Python: Getis-Ord Gi*, Moran's I and LISA on Birmingham road collisions

Run a hot spot analysis in Python with PySAL: aggregate 2025 STATS19 road collisions in Birmingham to a hexagon grid, test for clustering with global Moran's I, map Getis-Ord Gi* hot spots and LISA clusters with permutation inference and FDR correction, and see how spatial weights, the areal unit and exposure change the answer.

Intermediate 19 min read

Tutorial Python Part 2 of 2

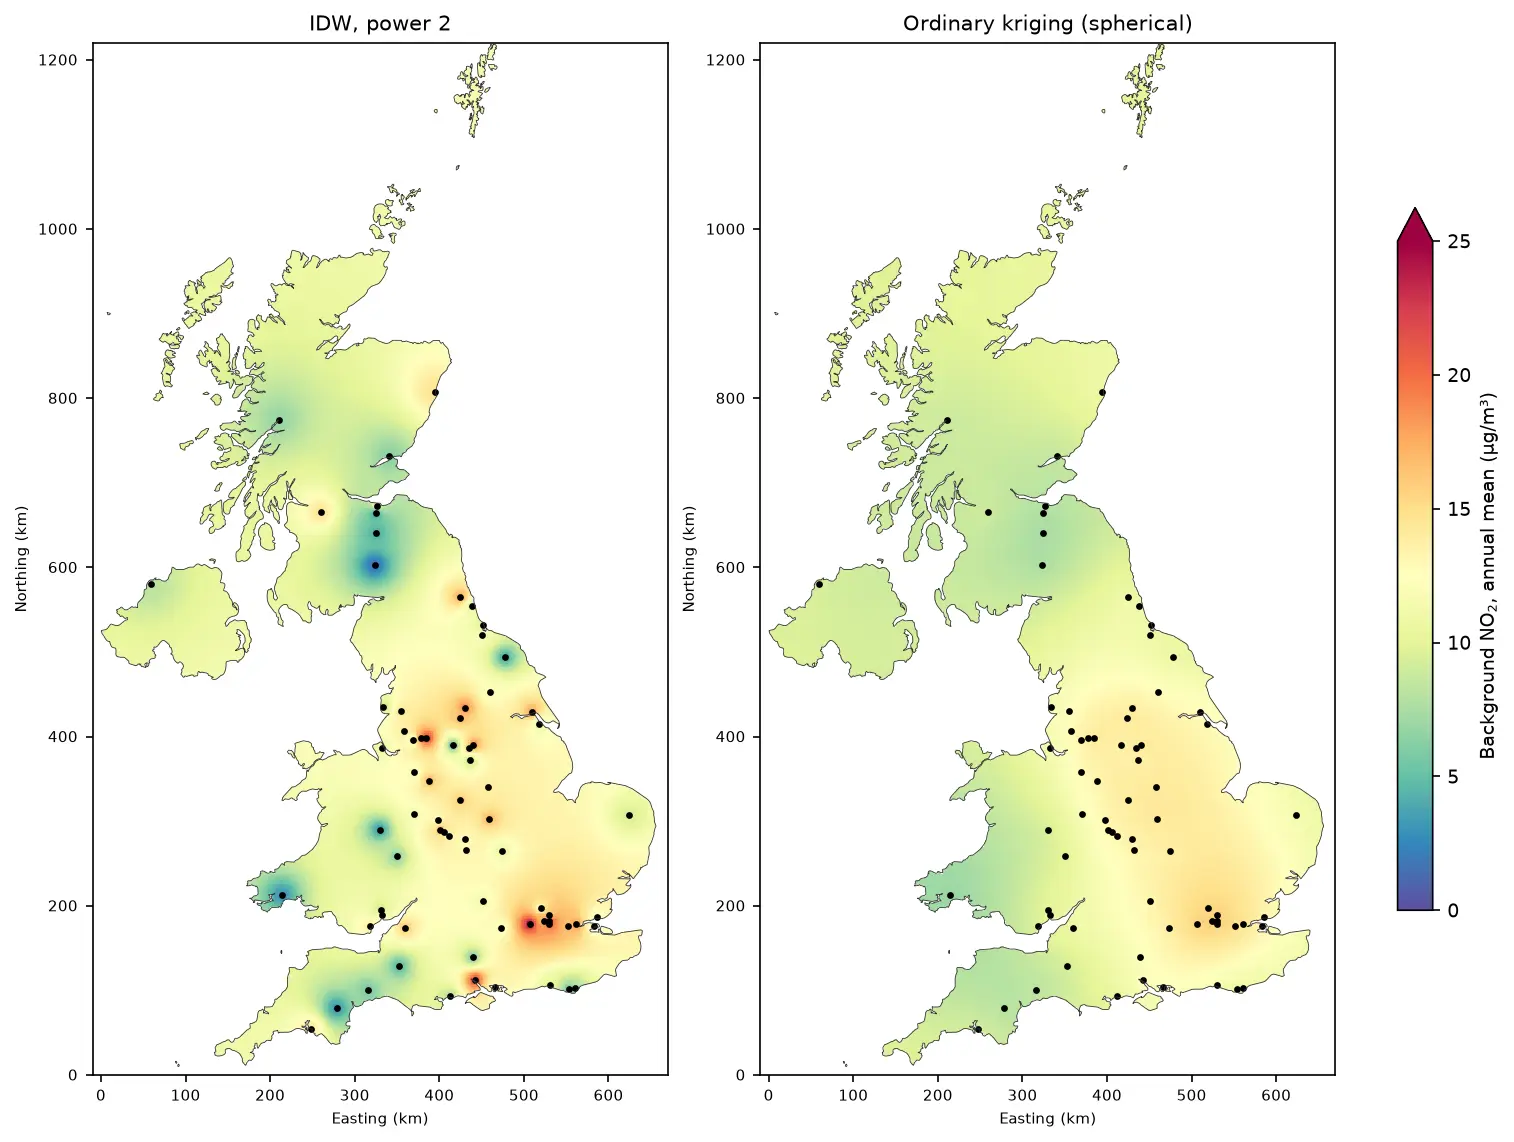
Kriging in Python with PyKrige: IDW vs ordinary kriging of UK NO₂ monitoring data

A practical spatial interpolation tutorial in Python: download real 2025 NO₂ annual means from the UK AURN network, fit spherical, exponential and Gaussian variograms, run ordinary kriging with PyKrige, compare it with inverse distance weighting, score both with leave-one-out cross-validation, map the kriging variance and add Sentinel-5P satellite NO₂ as a covariate.

Intermediate 16 min read