QGIS

Open-source desktop GIS: basemaps, plugins and cartography.

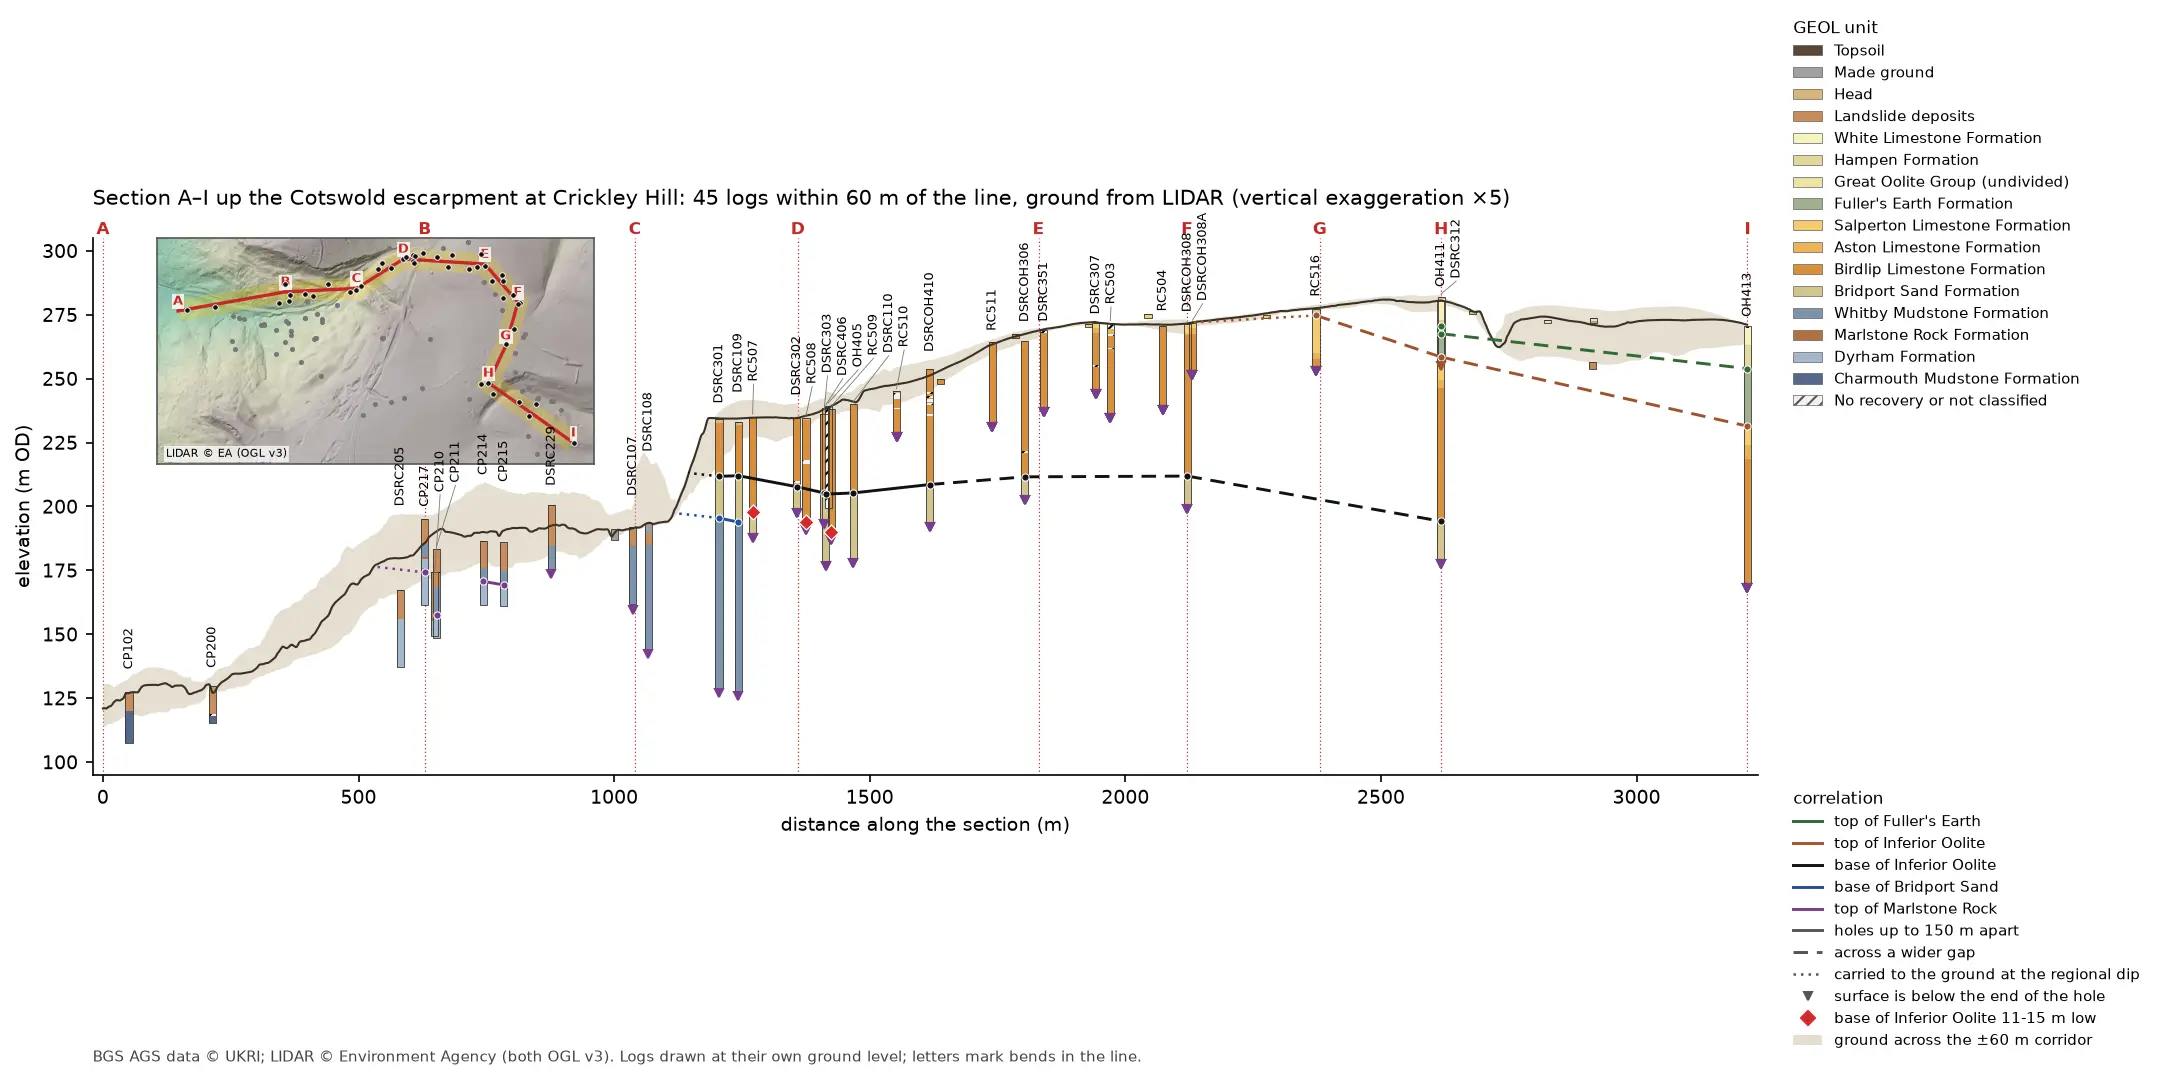
Geological cross-section 3.2 km long from the vale at A, up the Cotswold escarpment at Crickley Hill, to the plateau at I. A dark LIDAR ground line climbs from 121 to 281 m OD over a buff band showing the ground across the corridor. Forty-five strip logs hang below it, coloured by formation: blue-grey Lias mudstone in the vale, orange Inferior Oolite limestone on the escarpment and green Fuller's Earth on the plateau. Coloured lines join the contacts between holes, and red diamonds mark three holes where the base of the limestone is 11 to 15 m low. A map inset at top left shows the bent section line and its corridor on a LIDAR hillshade.

Tutorial Python Part 4 of 7

A geological cross-section from AGS4 boreholes and LIDAR in Python and QGIS

Draw a 3.2 km geological cross-section up the Cotswold escarpment from real AGS4 borehole logs, with the ground profile from Environment Agency LIDAR. Project every hole in a corridor onto the line, pick and correlate the contacts, and measure how much of each correlation line rests on a log and how much is inferred. Then draw the same section with the QGIS elevation profile.
Intermediate 15 min read

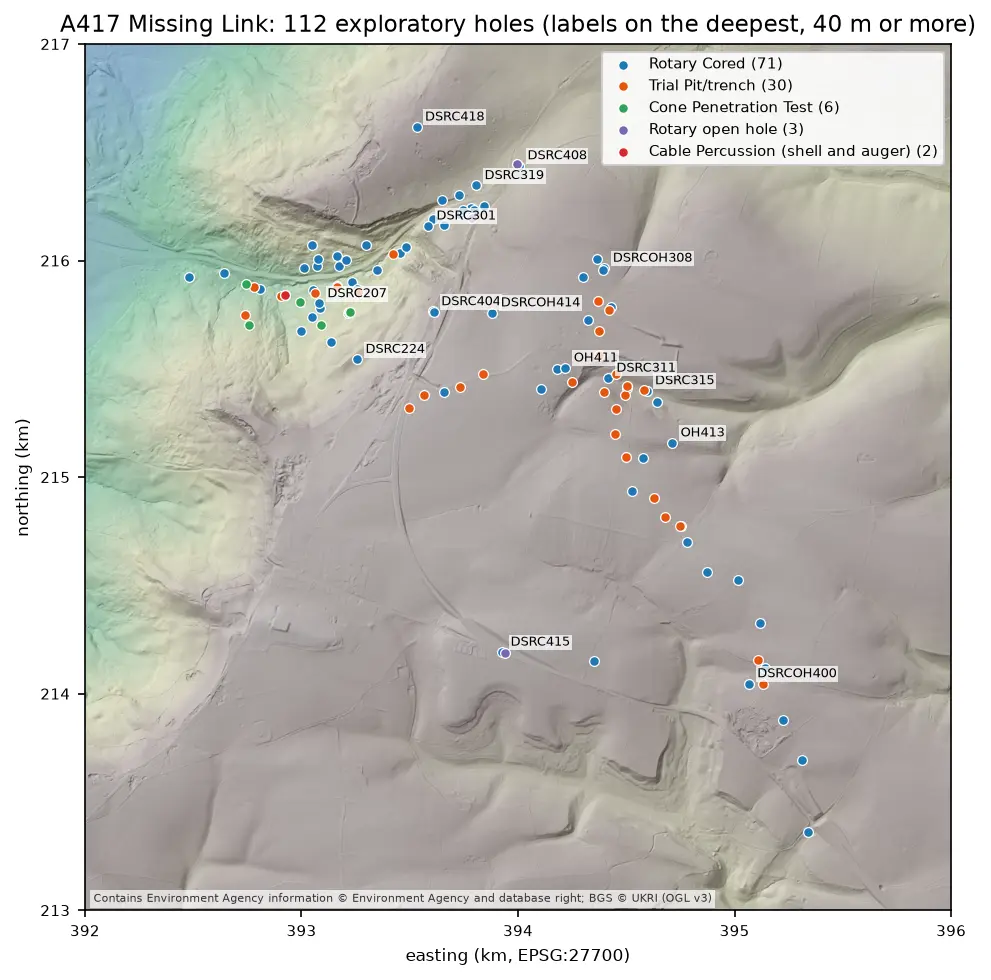
Map of the A417 Missing Link ground investigation on a grey LIDAR hillshade: 112 coloured points for rotary cored boreholes, trial pits, cone penetration tests, open holes and cable percussion boreholes, strung along the road corridor from the vale in the north-west, up the escarpment and south-east across the plateau, with the deepest holes labelled.

Tutorial Python Part 2 of 7

Boreholes on a map: AGS4 locations in British National Grid with QGIS

Turn the LOCA group of a real AGS4 file into points in British National Grid, see what happens when the CRS is wrong, summarise each hole's geology from GEOL, check every ground level against Environment Agency LIDAR, and build a QGIS project with labels and a map tip that shows the borehole log.

Intermediate 8 min read

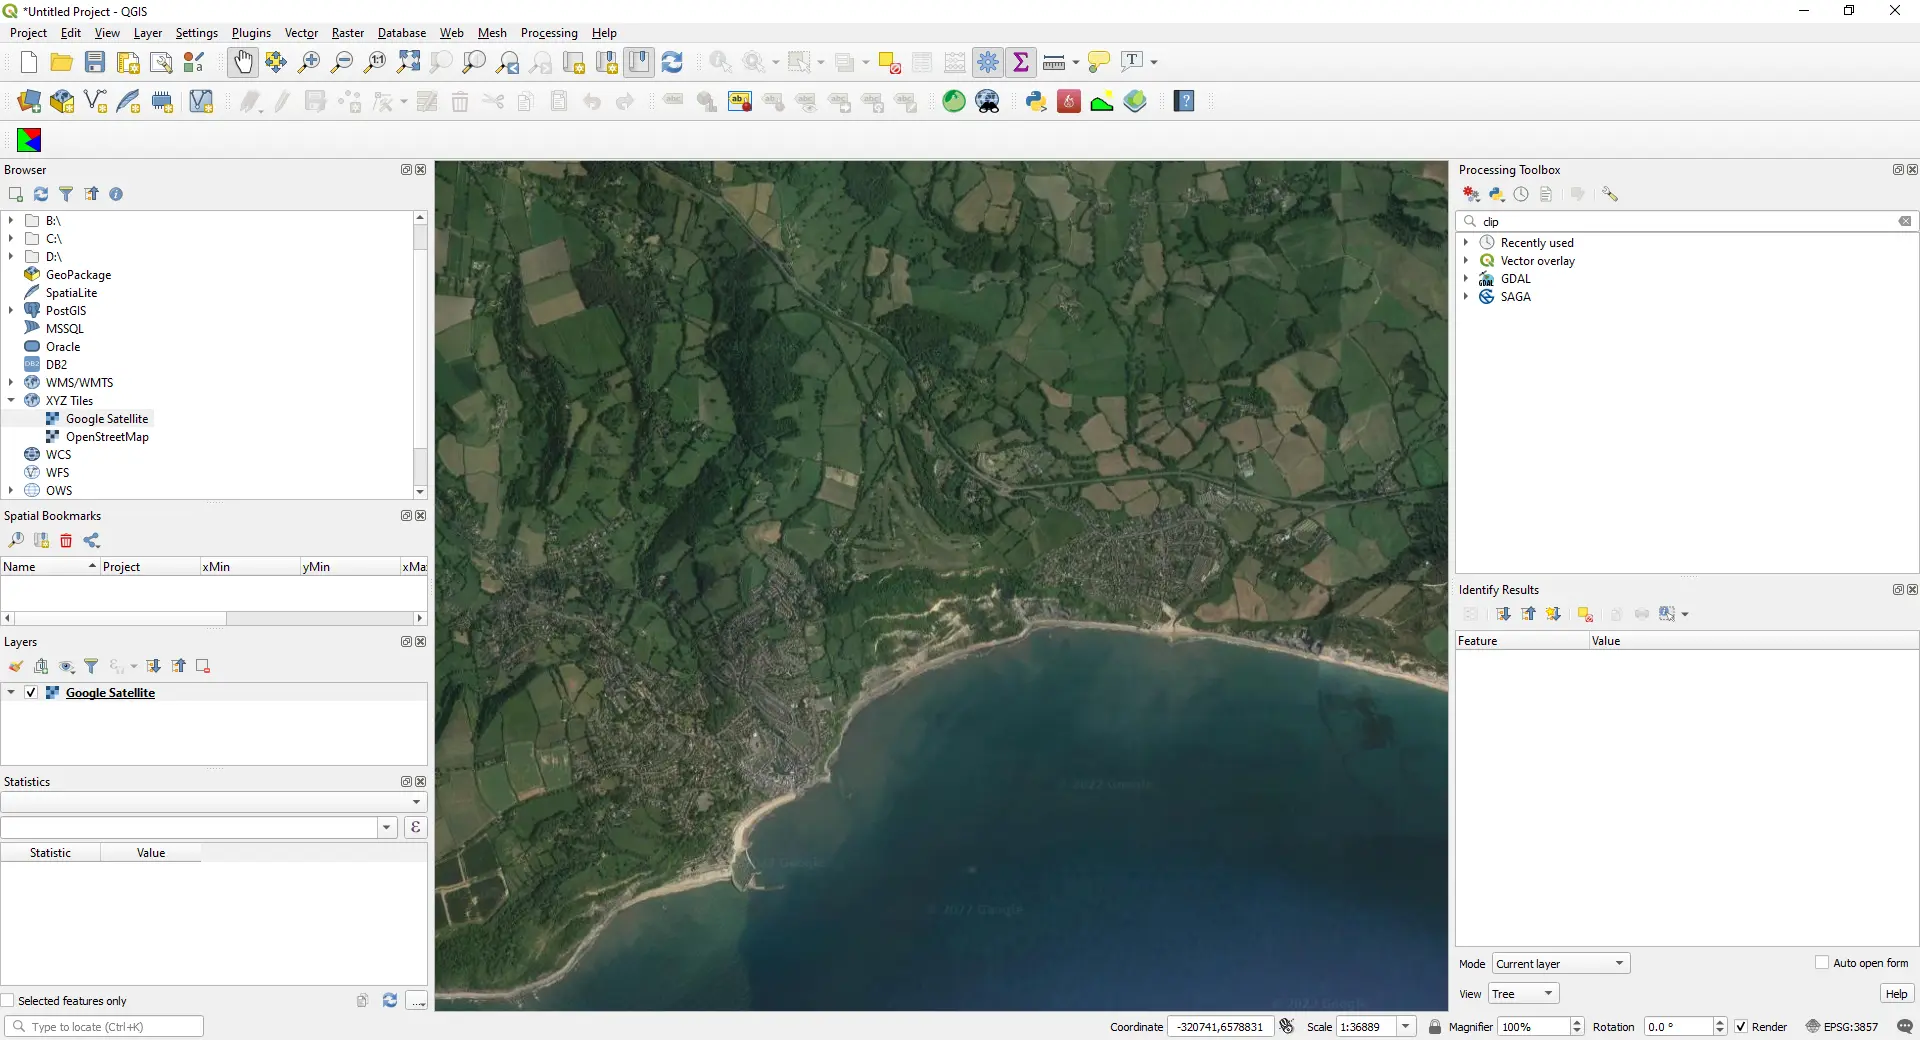
QGIS map window showing Google satellite imagery of a stretch of the south coast of England, loaded as an XYZ Tiles layer (screenshot from the original 2022 version of this post).

Article QGIS

How to Add Google Maps and OpenStreetMap Layers to QGIS

Add OpenStreetMap, satellite and Google basemaps to QGIS 3.40 LTR, 3.44 and 4.x as XYZ Tiles connections: the correct tile URLs, the OpenStreetMap tile usage policy, the licence-safe ways to get Google, Esri and Sentinel-2 imagery, and the same basemaps from PyQGIS, folium, leafmap and contextily.

Beginner 13 min read