#Accuracy assessment

5 posts

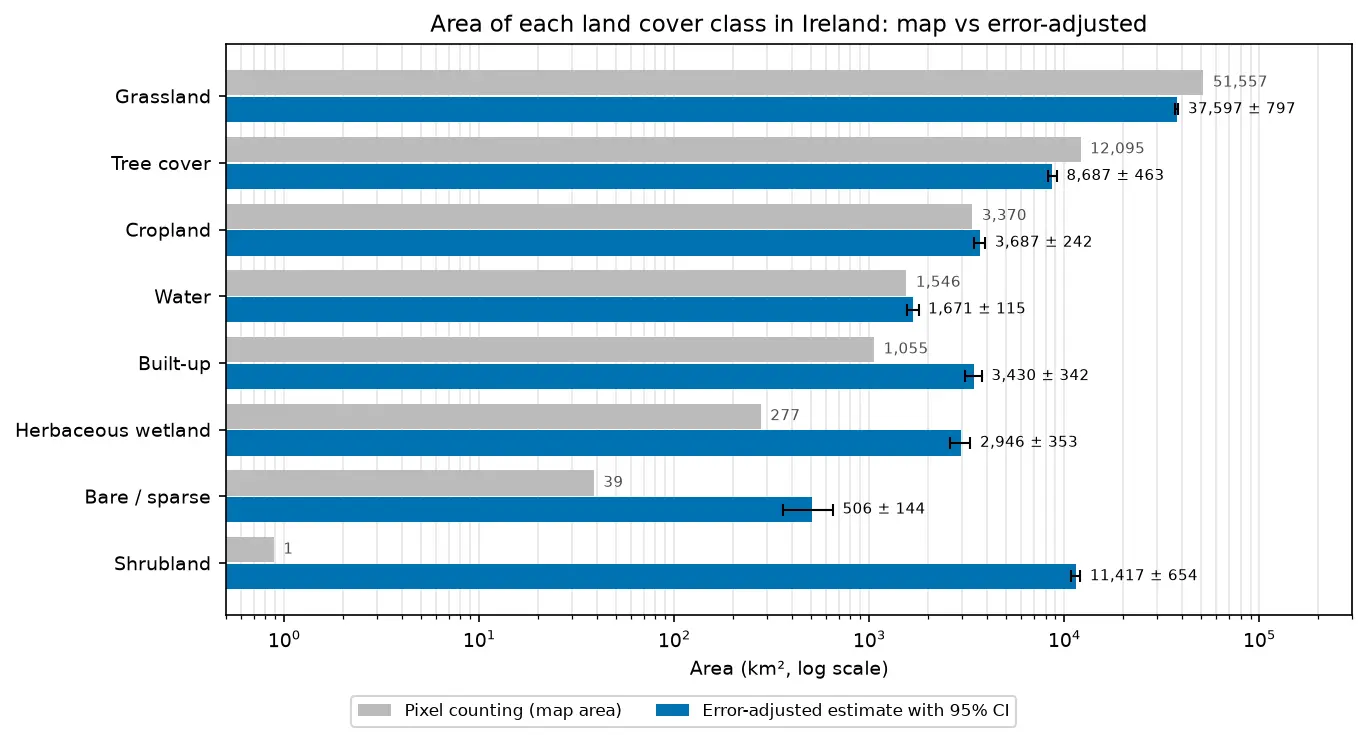
Bar chart comparing the area of each land cover class in Ireland from WorldCover pixel counting with the error-adjusted estimate and its 95% confidence interval.

Tutorial Remote Sensing

Land cover accuracy assessment in Python: confusion matrix, Olofsson area estimates and sample size

Assess a real land cover map in Python: ESA WorldCover 2021 against 8,597 Eurostat LUCAS 2022 field survey points in Ireland. Build the confusion matrix, compute overall, user's and producer's accuracy, see why kappa is discouraged, and use the Olofsson et al. (2014) stratified estimators to get error-adjusted areas with 95% confidence intervals and to plan a new stratified random sample.
Advanced 20 min read

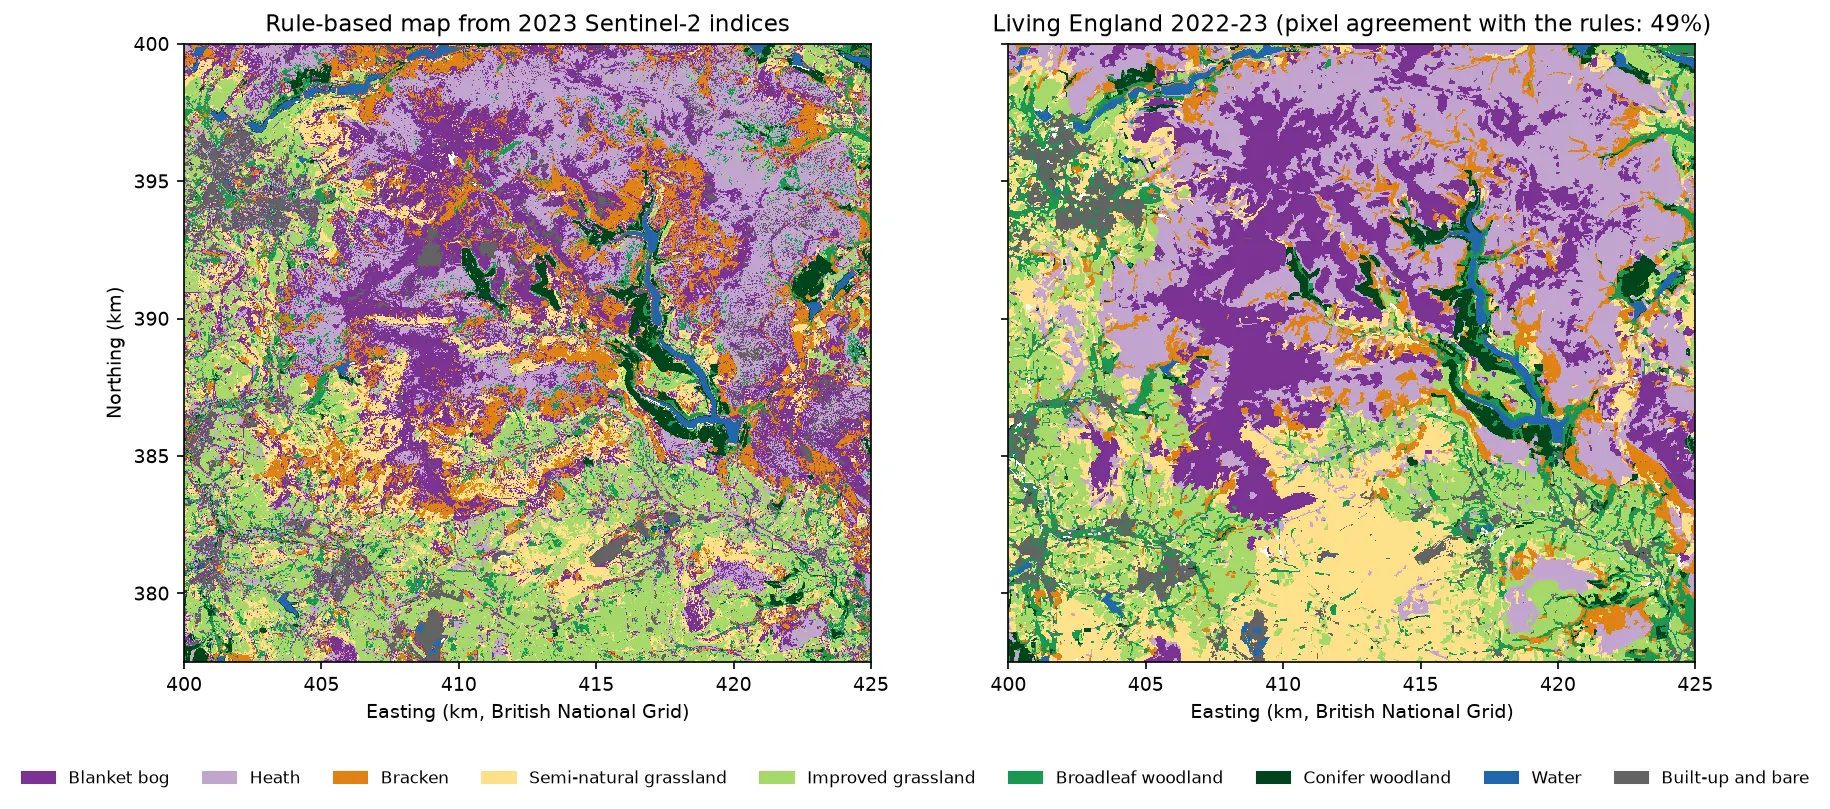
Two habitat maps of the Dark Peak side by side. Left: the rule-based map from Sentinel-2, with purple blanket bog and lilac heath on the Kinder and Bleaklow plateaux, orange bracken on the valley sides, green grassland and woodland in the valleys and blue reservoirs in the Derwent valley. Right: Living England 2022-23 for the same area, with smoother patches of the same classes.

Tutorial Python Part 1 of 5

Habitat mapping with Sentinel-2 in Python: spectral index rules and an honest accuracy assessment

Map blanket bog, heath, bracken, grassland, woodland, water and built-up land in the Peak District from 2023 Sentinel-2 seasonal composites with an eight-rule spectral index classifier, then assess it properly: a confusion matrix, user's and producer's accuracy, kappa and its caveats, block-bootstrap confidence intervals, and why a random train/test split overstates accuracy.

Beginner 19 min read

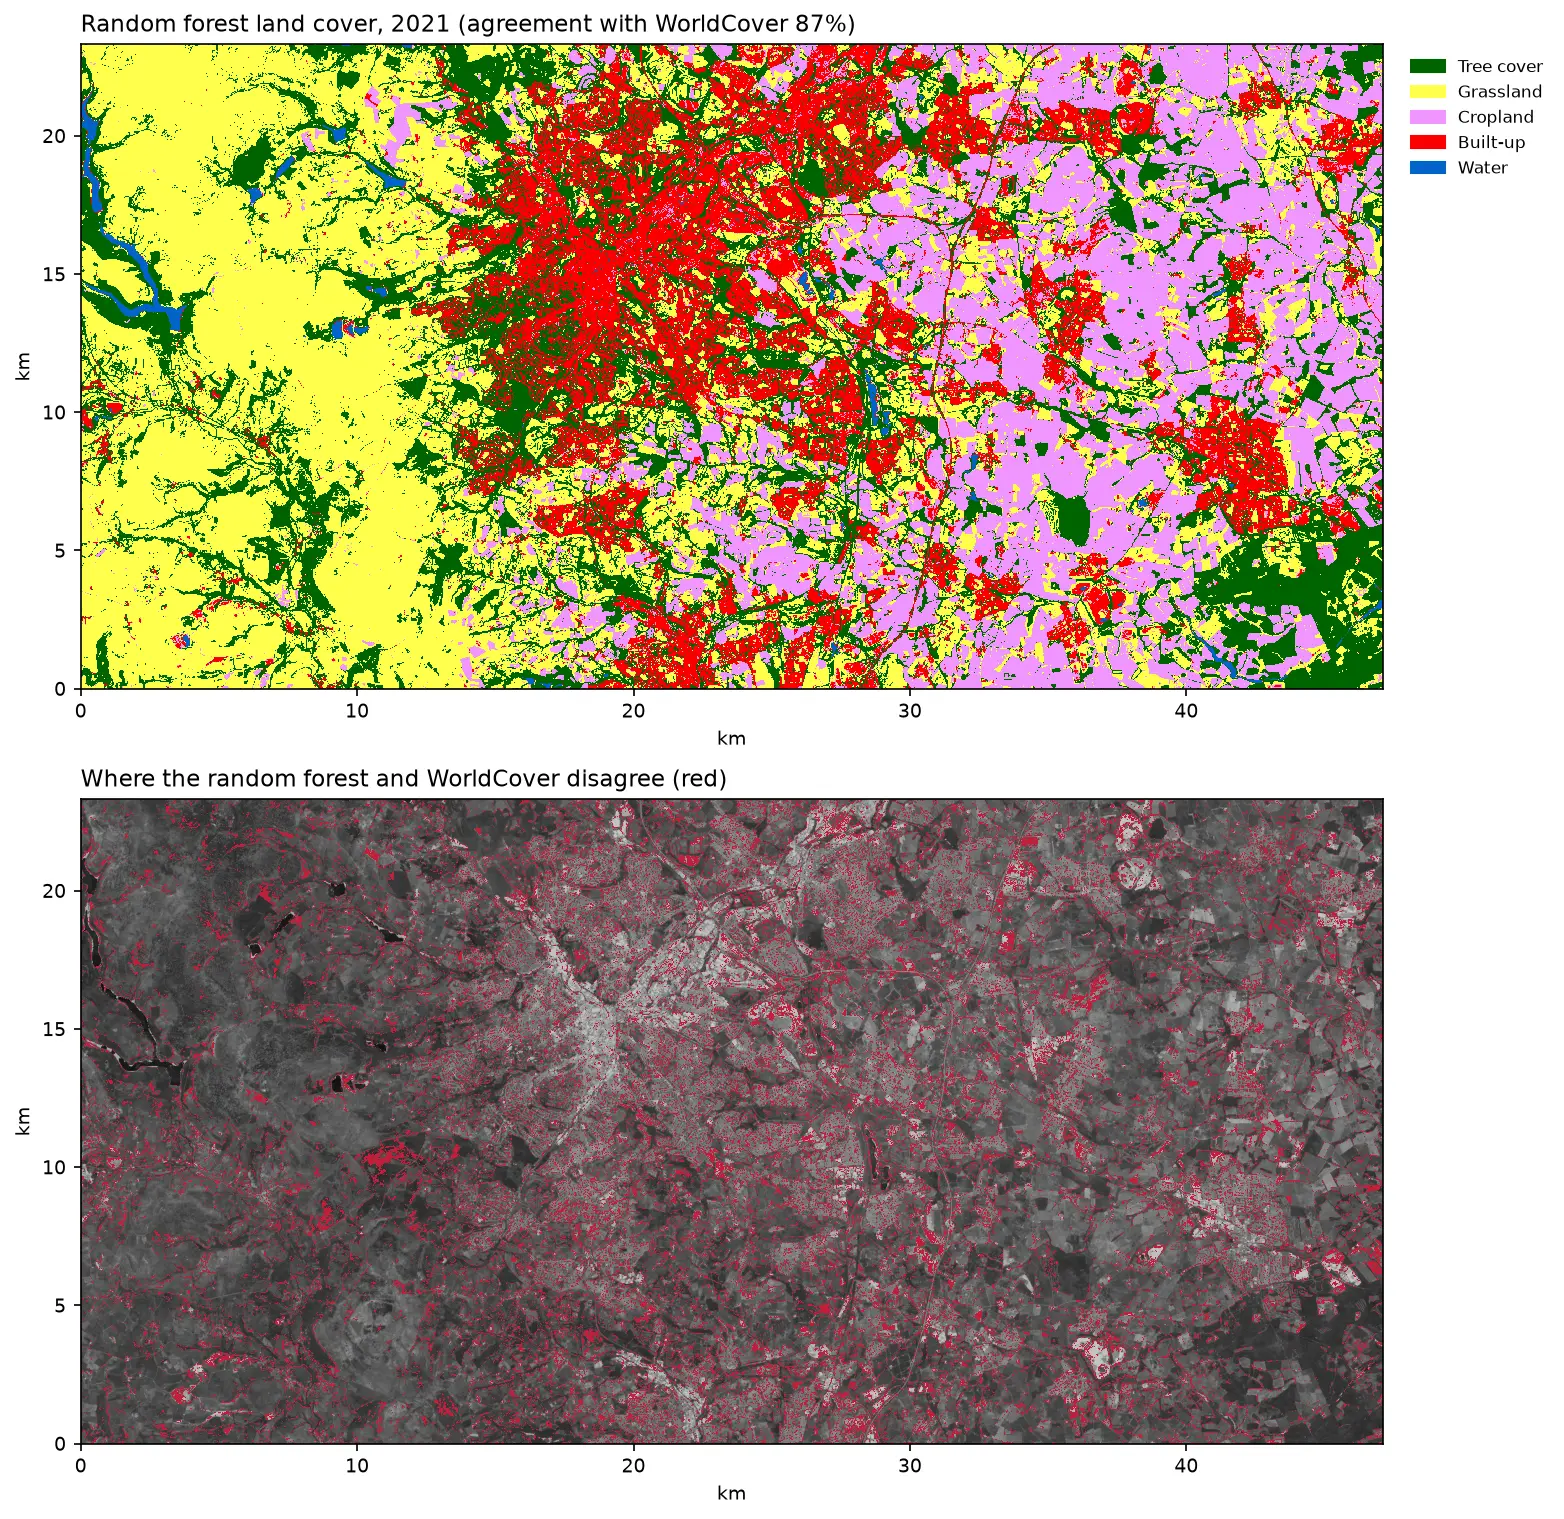
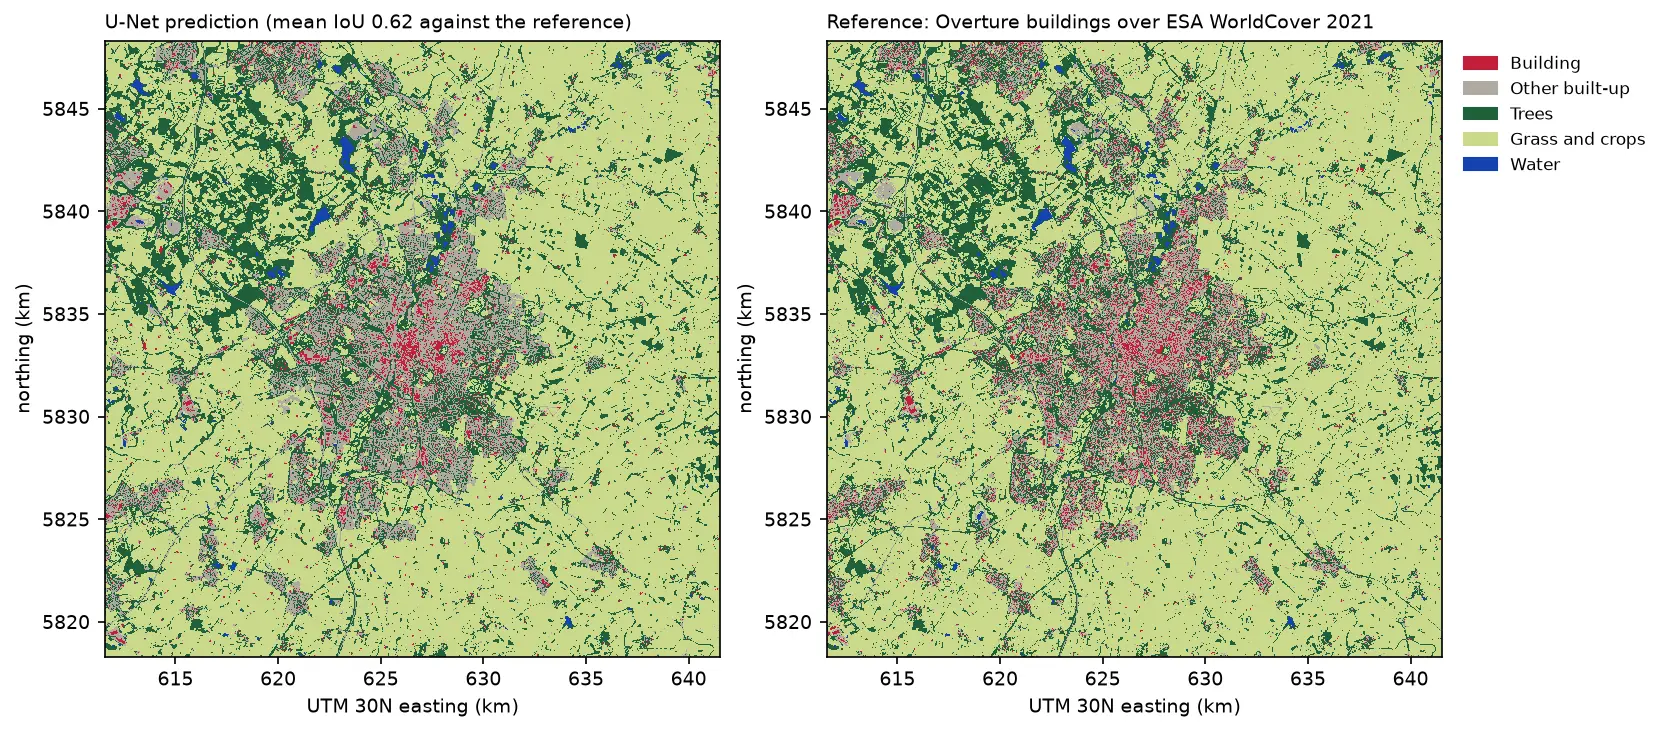
Two land cover maps of a 30 km square around Leicester side by side: the U-Net prediction on the left and the reference labels on the right. Both show the city in grey and red in the centre, surrounded by farmland in pale green, woods in dark green and reservoirs in blue. The prediction's city is smoother, with fewer separate red buildings.

Tutorial Python Part 3 of 3

Deep learning inference on large rasters: sliding-window prediction, COGs and polygons in Python

Run a trained PyTorch U-Net over a whole Sentinel-2 scene of a city it has never seen: tiled sliding-window inference on a large GeoTIFF with overlapping, blended windows, a georeferenced Cloud Optimised GeoTIFF of classes and confidence, raster-to-vector polygons with rasterio.features.shapes in a GeoPackage, and an honest check against reference labels.

Advanced 13 min read

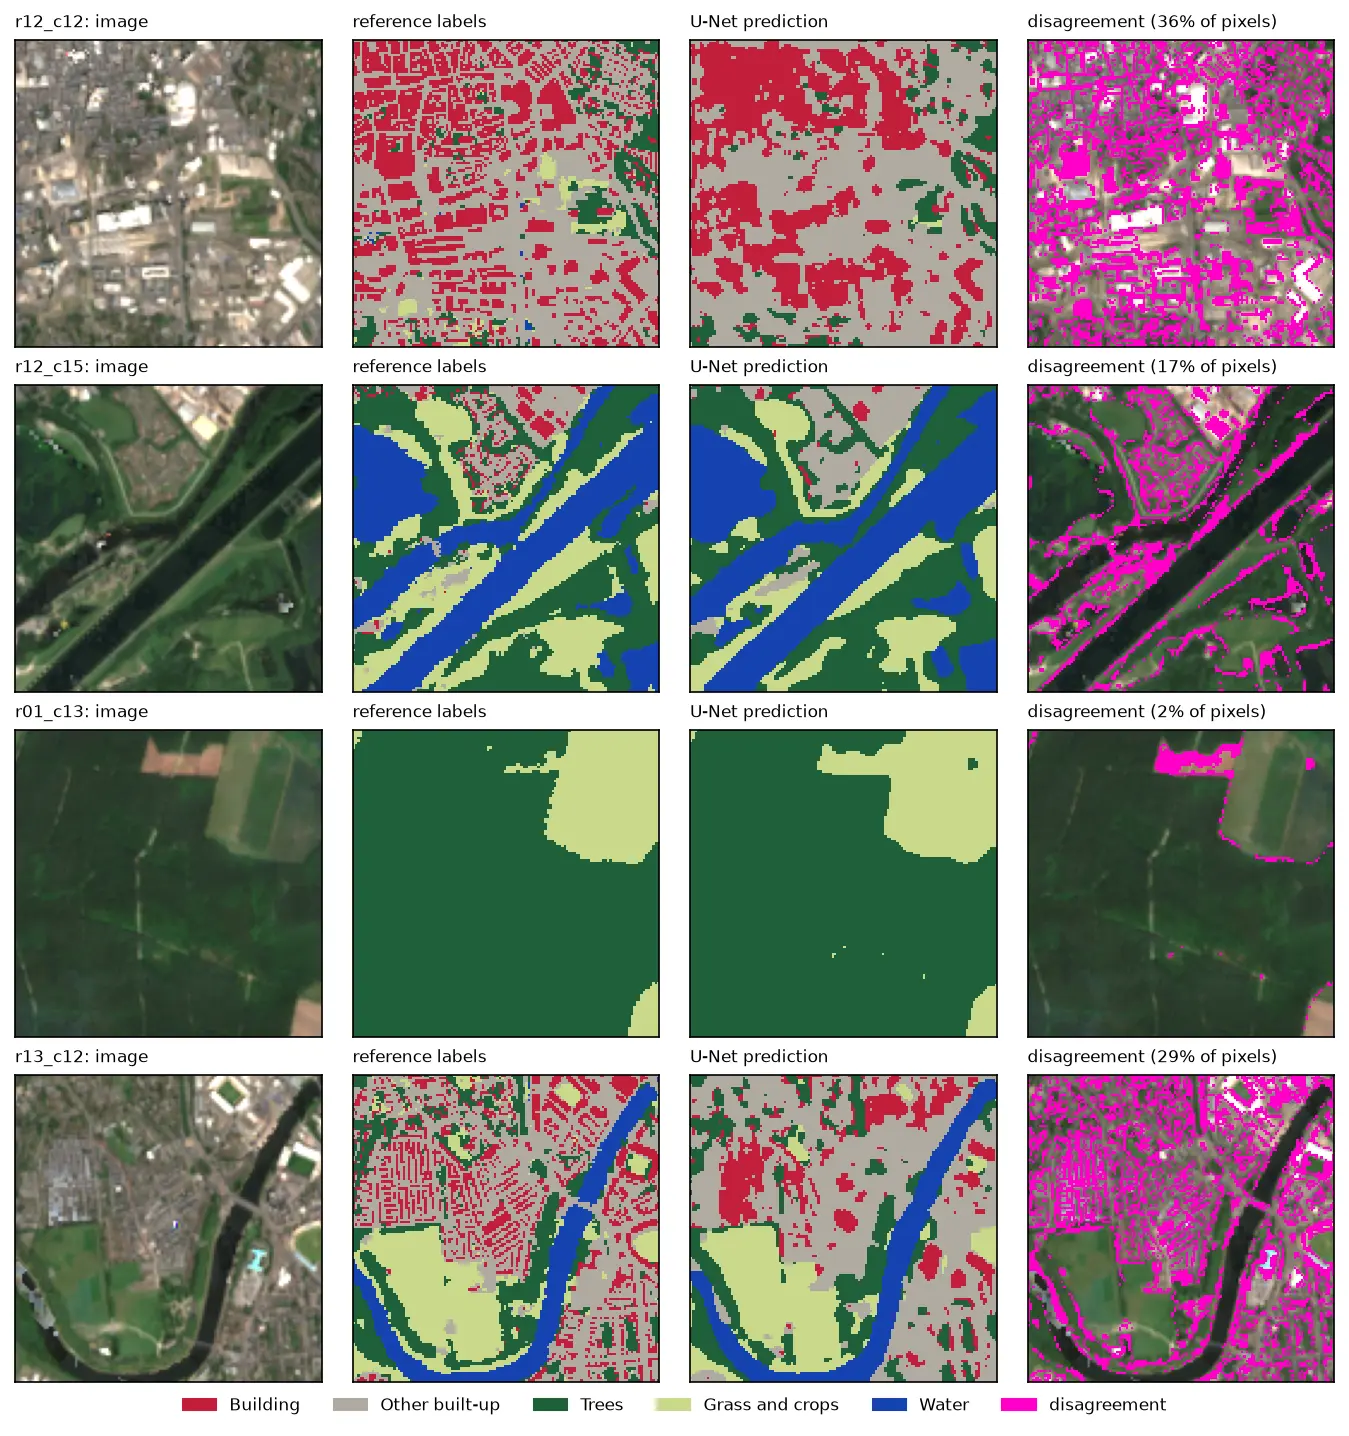
Four rows of Sentinel-2 test chips. Each row shows the image, the reference labels, the U-Net prediction and the disagreement in magenta. The prediction matches rivers, woods and fields closely, but in the city centre it draws buildings as blobs instead of separate roofs.

Tutorial Python Part 2 of 3

U-Net satellite image segmentation in PyTorch: a TorchGeo and Sentinel-2 tutorial on a CPU

Train a U-Net to segment Sentinel-2 imagery into buildings, built-up land, trees, grass and water with PyTorch, segmentation_models_pytorch and TorchGeo's Sentinel-2 pretrained ResNet-18 weights, on a CPU in five minutes. Real loss curves, per-class IoU and F1, a confusion matrix and an honest look at what limits accuracy.

Advanced 12 min read