#Census 2021

7 posts

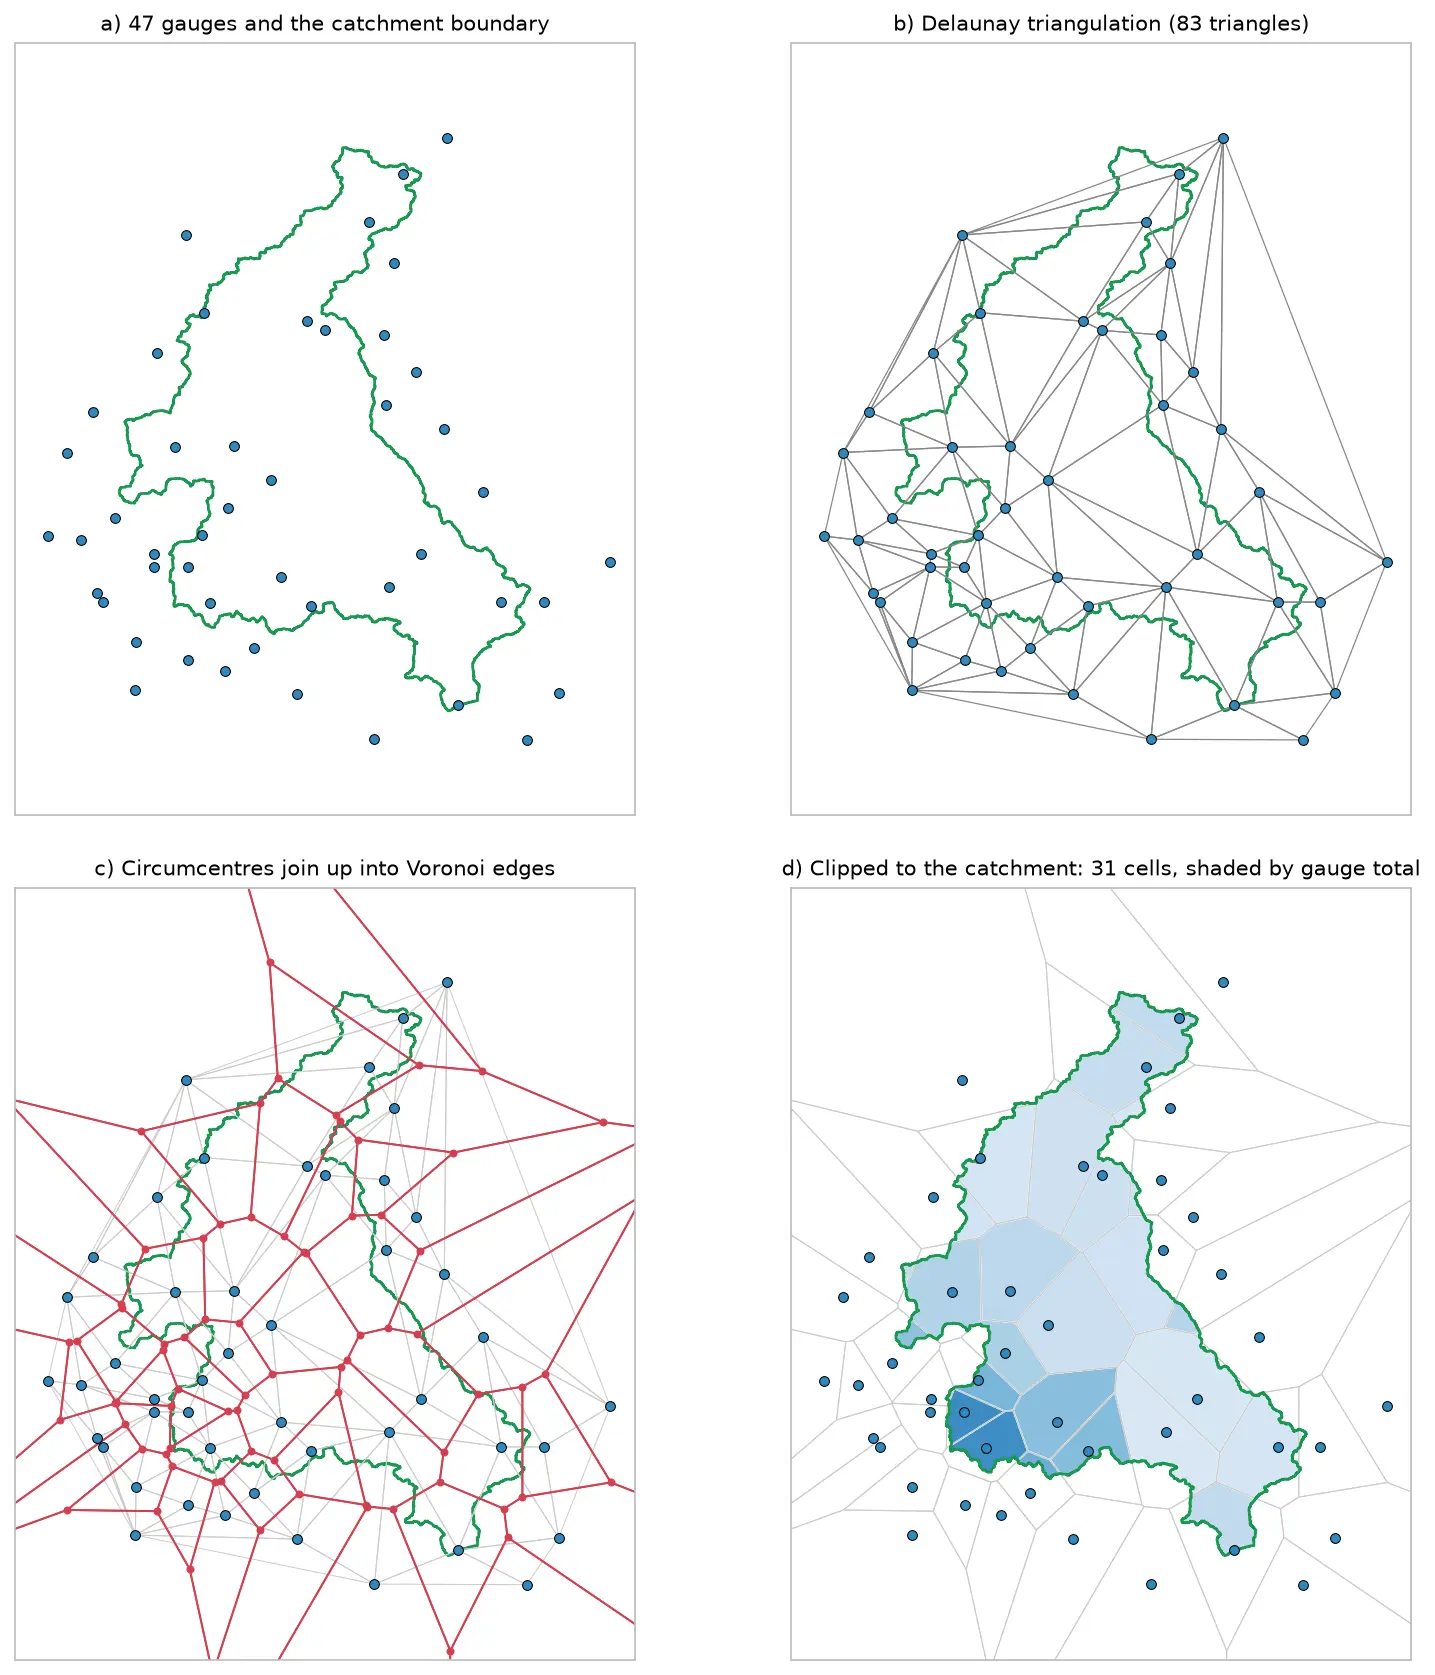
Four panels showing how Voronoi polygons are built for 47 rain gauges around the River Eden catchment: the gauges and the catchment outline, their Delaunay triangulation, the triangle circumcentres joined into red Voronoi edges, and the cells clipped to the catchment and shaded by each gauge's rainfall.

Tutorial Python

Voronoi (Thiessen) polygons in Python: catchment rainfall from EA rain gauges and fire station areas in Cumbria

Build Voronoi (Thiessen) polygons in Python with shapely and GeoPandas, clipped to a real boundary. Compute Thiessen-weighted catchment rainfall for the River Eden from Environment Agency rain gauge readings, check the gauges, compare with the gauge average and IDW, then compare Voronoi 'nearest fire station' areas in Cumbria with drive-time service areas from OpenStreetMap.
Intermediate 15 min read

Tutorial Python

Geodemographic classification in Python: k-means on Census 2021 Output Areas, and SKATER and max-p regionalisation

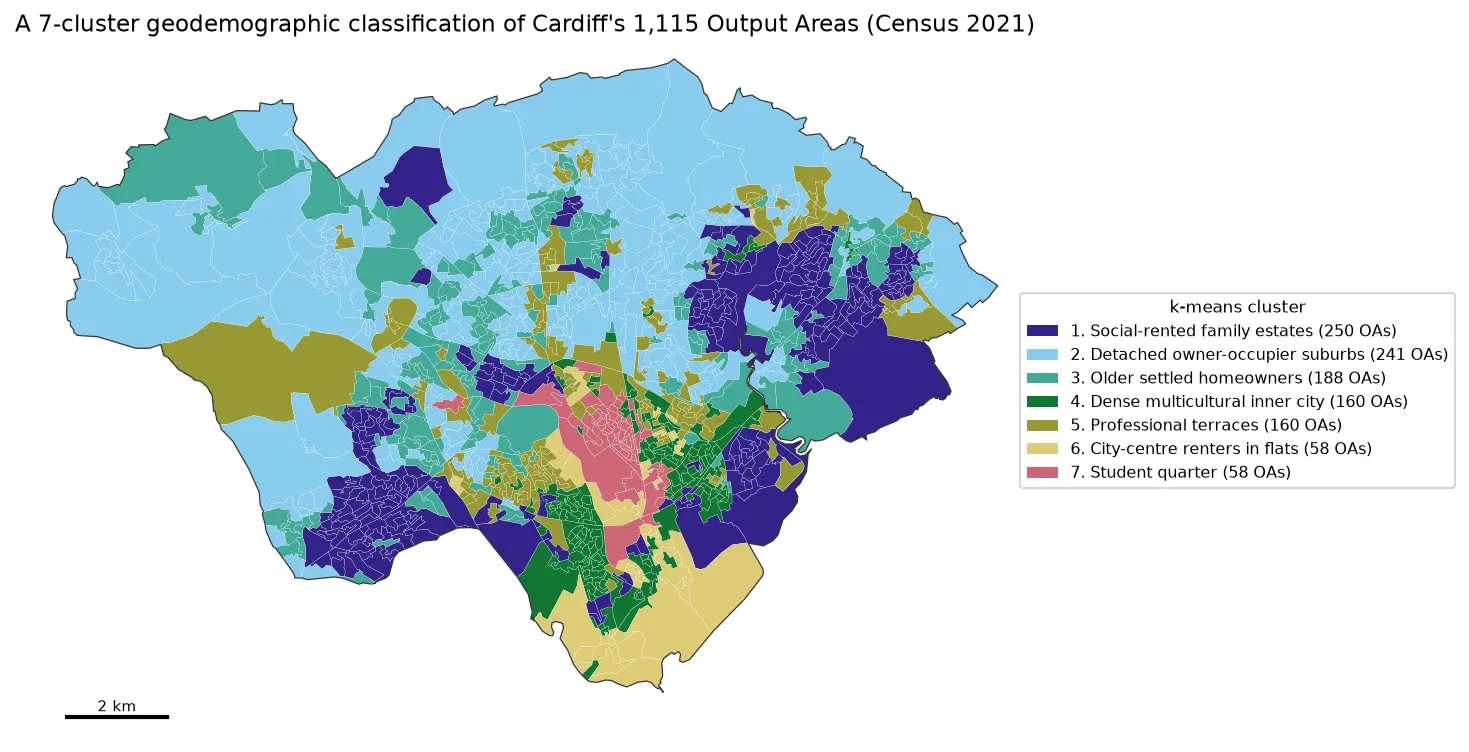
Build a small geodemographic classification of Cardiff's 1,115 Census 2021 Output Areas in Python: choose and transform variables from Nomis bulk tables, standardise them, check correlations, choose k for k-means with the elbow, silhouette and stability across seeds, profile and cautiously name the clusters with index scores and radar charts, compare the result with the official 2021/2 OAC, test the MAUP at LSOA level, and contrast it with contiguous regions from spopt's SKATER and max-p.

Intermediate 17 min read

Tutorial Python Part 1 of 2

Two-step floating catchment area (2SFCA) in Python: spatial access to GP practices in Cornwall

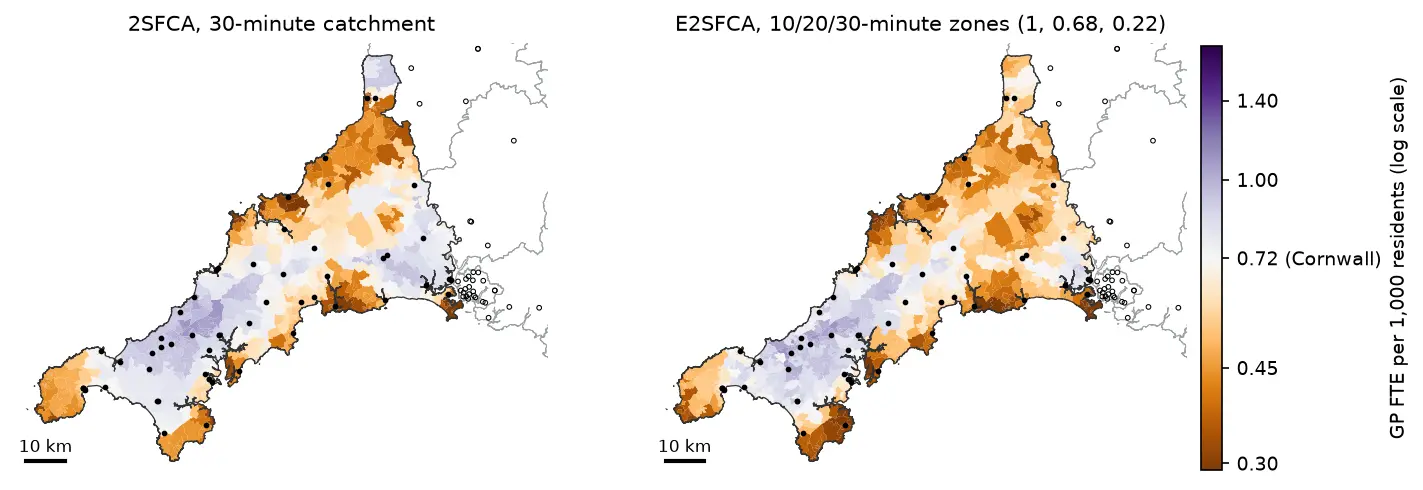
Measure spatial accessibility to GP practices in Python with the two-step floating catchment area (2SFCA) method and its distance-decay version (E2SFCA). Build OSMnx drive times for Cornwall from OpenStreetMap, use NHS GP workforce data and Census 2021 population, compare the PySAL access package with a vectorised NumPy version, and test the catchment threshold, the decay function and edge effects.

Intermediate 18 min read

Tutorial Spatial Analysis Part 1 of 2

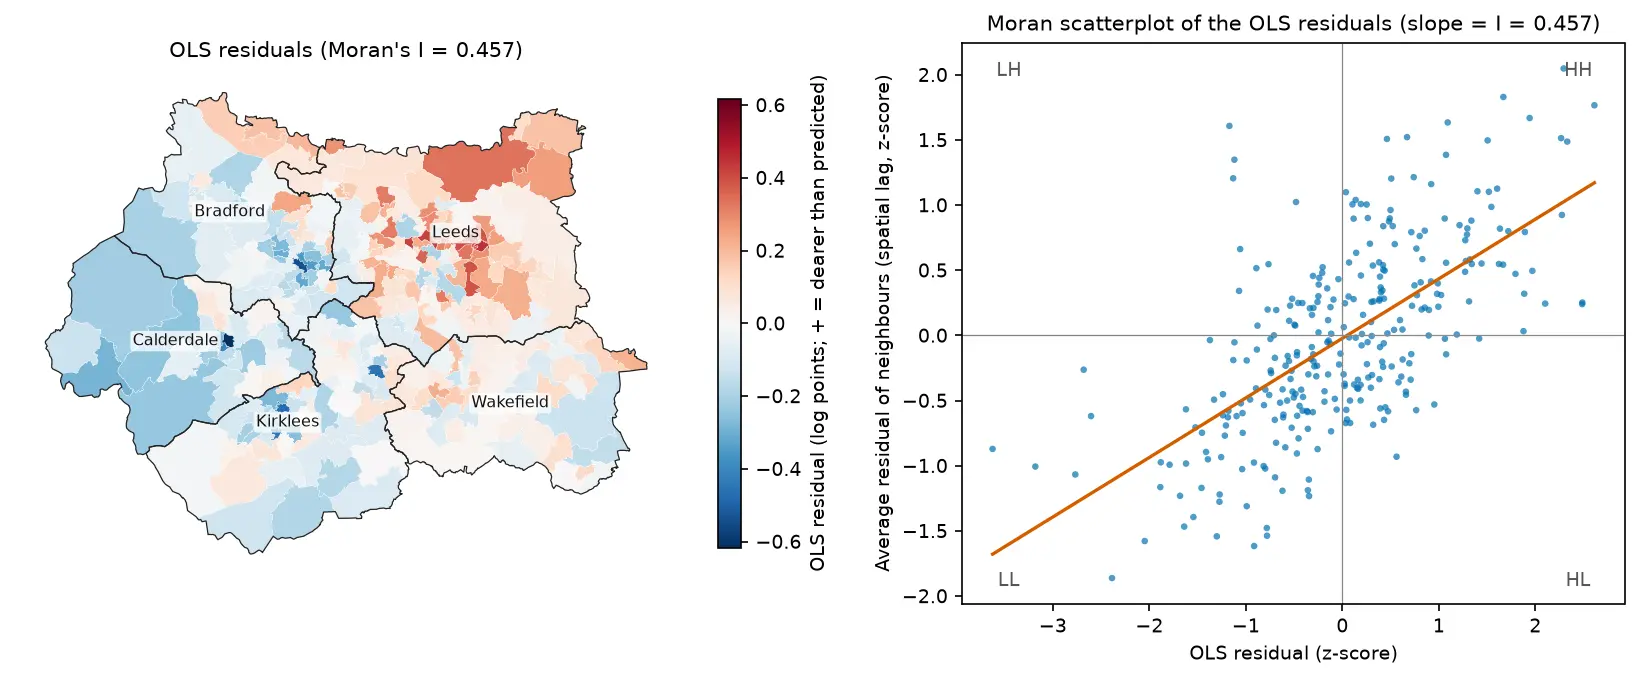
Spatial regression in Python: OLS diagnostics, spatial lag and spatial error models with spreg

Fit spatial regression models in Python with PySAL's spreg on real West Yorkshire house prices: test the OLS residuals for spatial autocorrelation, read the Lagrange Multiplier diagnostics, fit spatial lag and spatial error models, compare them by AIC and log-likelihood, interpret direct, indirect and total impacts, and check how much the spatial weights matter.

Intermediate 18 min read

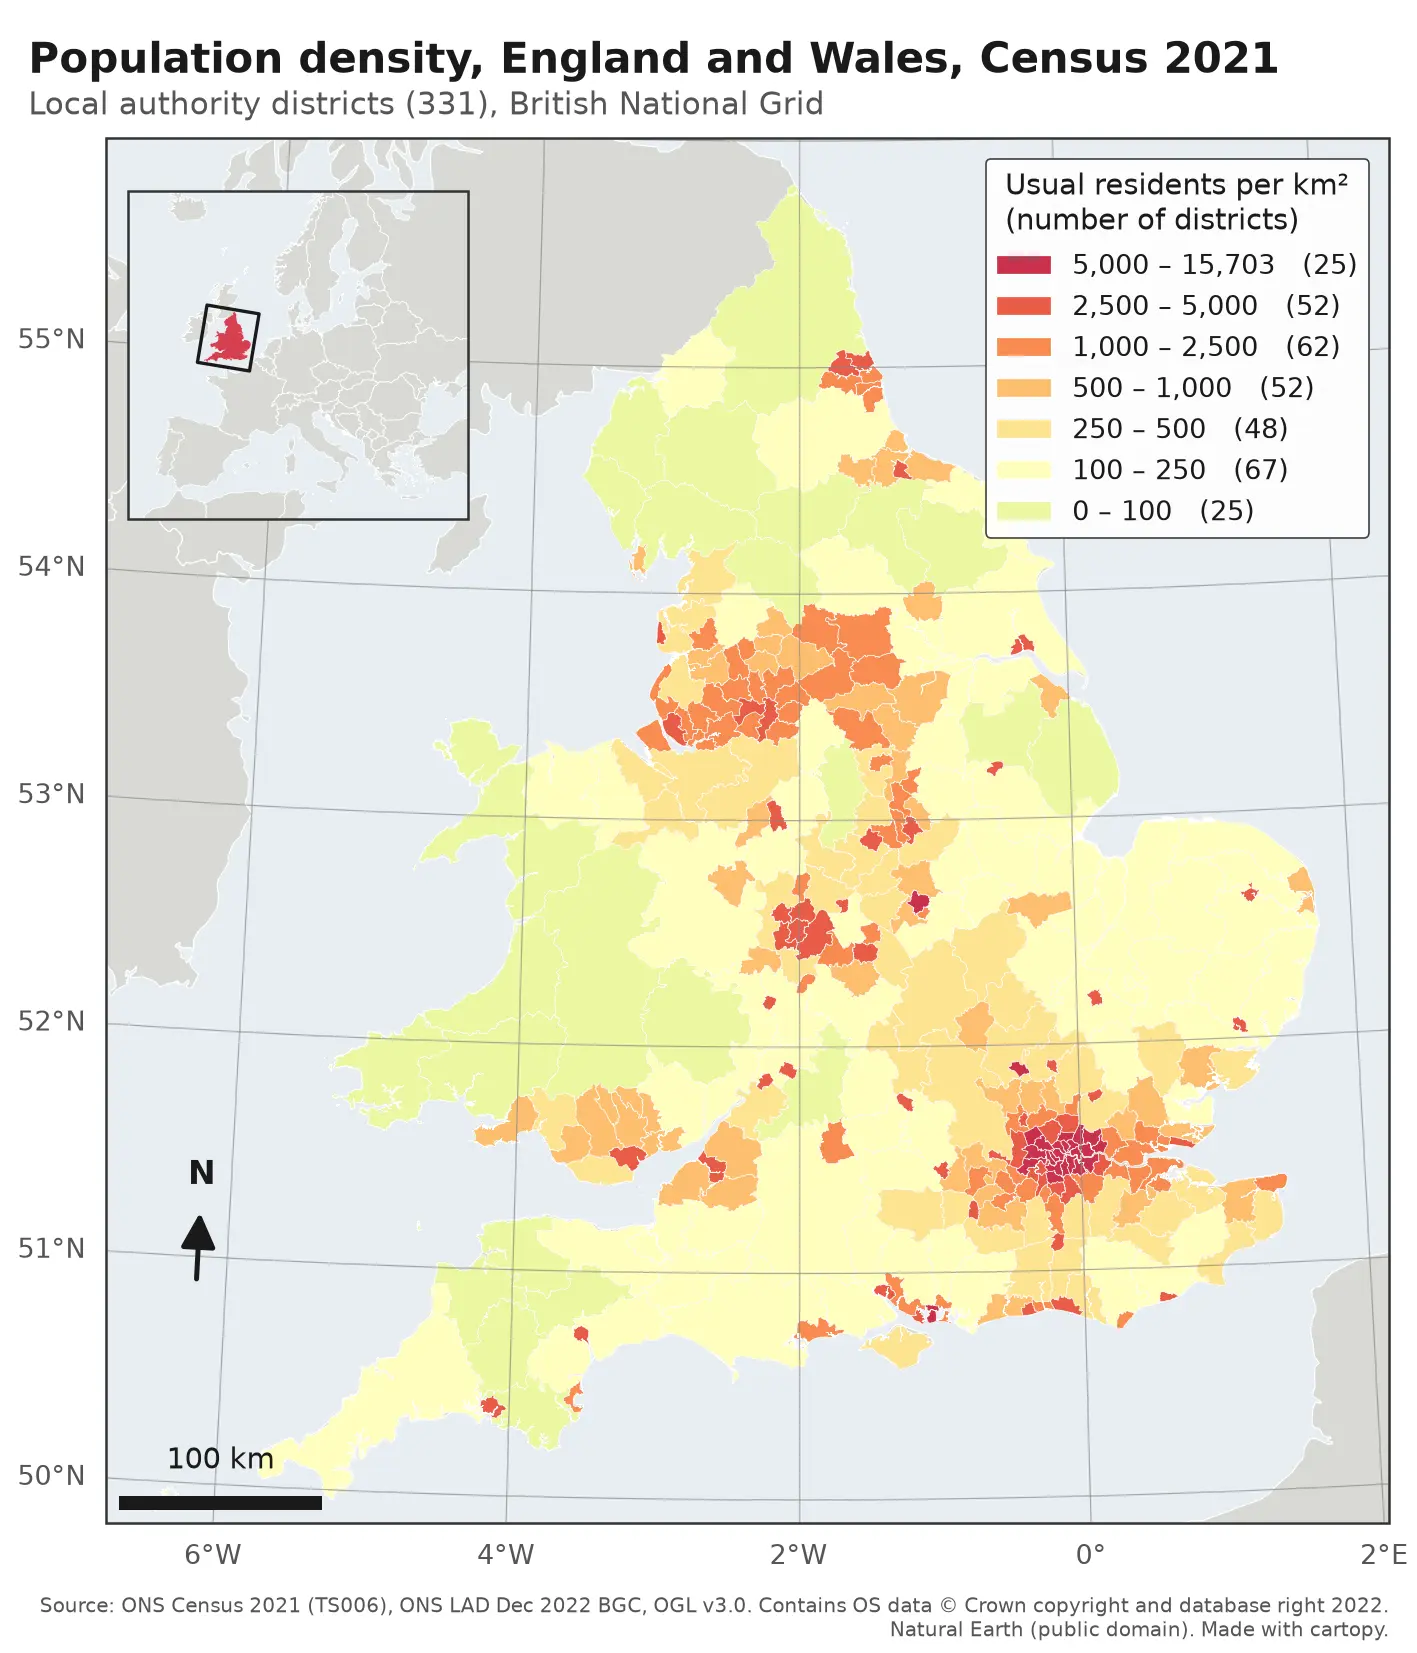
Choropleth map of population density in the 331 local authority districts of England and Wales from Census 2021, in seven classes from pale yellow (under 100 residents per km²) to deep red (over 5,000). London, Birmingham, Manchester, Liverpool, Leeds, Newcastle and the south coast cities stand out in red; Wales, Cumbria, Northumberland and Lincolnshire are pale. The map has a classified legend, a 100 km scale bar, a north arrow, latitude and longitude labels and an inset locator map of Europe.

Tutorial Python

Make a map in Python with matplotlib and cartopy: projections, classified choropleths, scale bars, north arrows and inset maps

A cartopy tutorial for publication-quality maps in Python: choose a projection, draw a classified choropleth of Census 2021 population density with a proper legend, add a scale bar, a true-north arrow, an inset locator map and gridlines, style it for light and dark backgrounds, export at 300 dpi to PNG, PDF and SVG, and shade the Copernicus DEM for Greater Manchester.

Beginner 14 min read

Tutorial Python Part 2 of 3

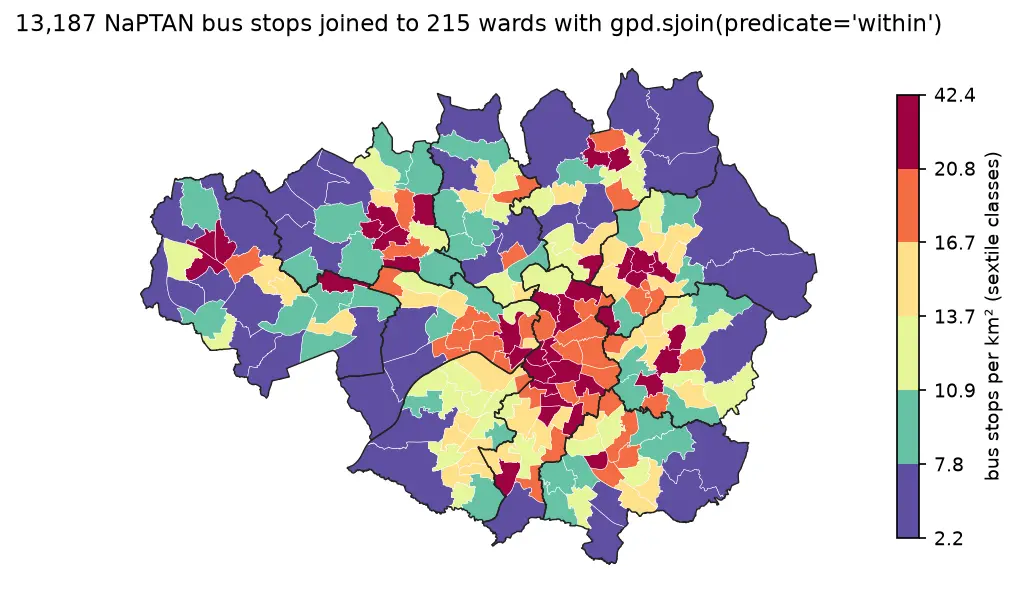
Spatial joins in GeoPandas: sjoin, predicates, sjoin_nearest and point in polygon

A practical guide to spatial joins in GeoPandas with real Greater Manchester data: 13,187 NaPTAN bus stops, 1,386 OpenStreetMap schools, 215 ONS wards and 1,702 LSOAs. Covers point in polygon with sjoin, predicates, counts per polygon, how='left'/'inner'/'right', sjoin_nearest with max_distance, clip and overlay, and a timing comparison of a naive loop against the spatial index.

Beginner 12 min read

Tutorial Python

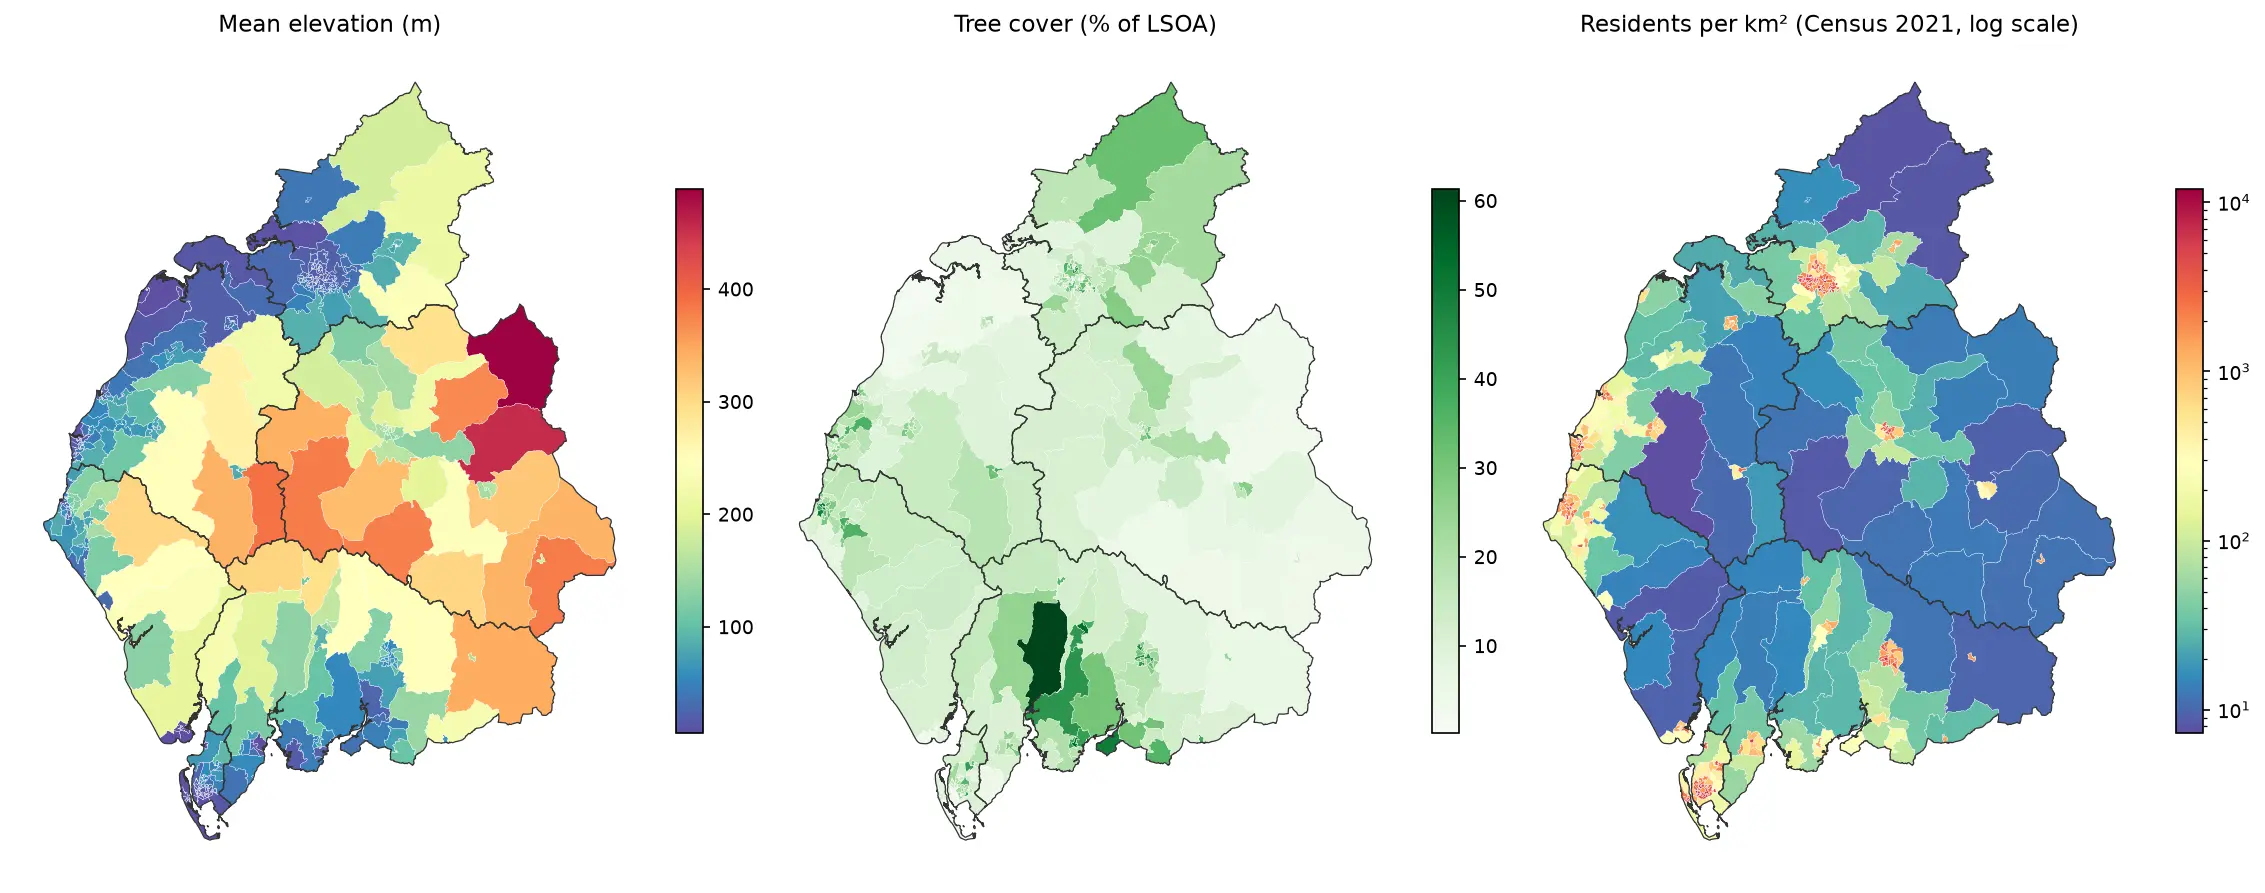
Zonal statistics in Python: exactextract vs rasterstats, with partial pixels, land-cover fractions and a benchmark

Calculate zonal statistics in Python with exactextract and rasterstats on real data: ONS 2021 LSOA boundaries for Cumbria with GHSL population, the Copernicus DEM and ESA WorldCover. Covers partial-pixel weighting vs pixel centroids, CRS alignment, categorical land-cover fractions, a speed benchmark, GeoPackage export and choropleth maps.

Intermediate 14 min read