#GDAL

4 posts

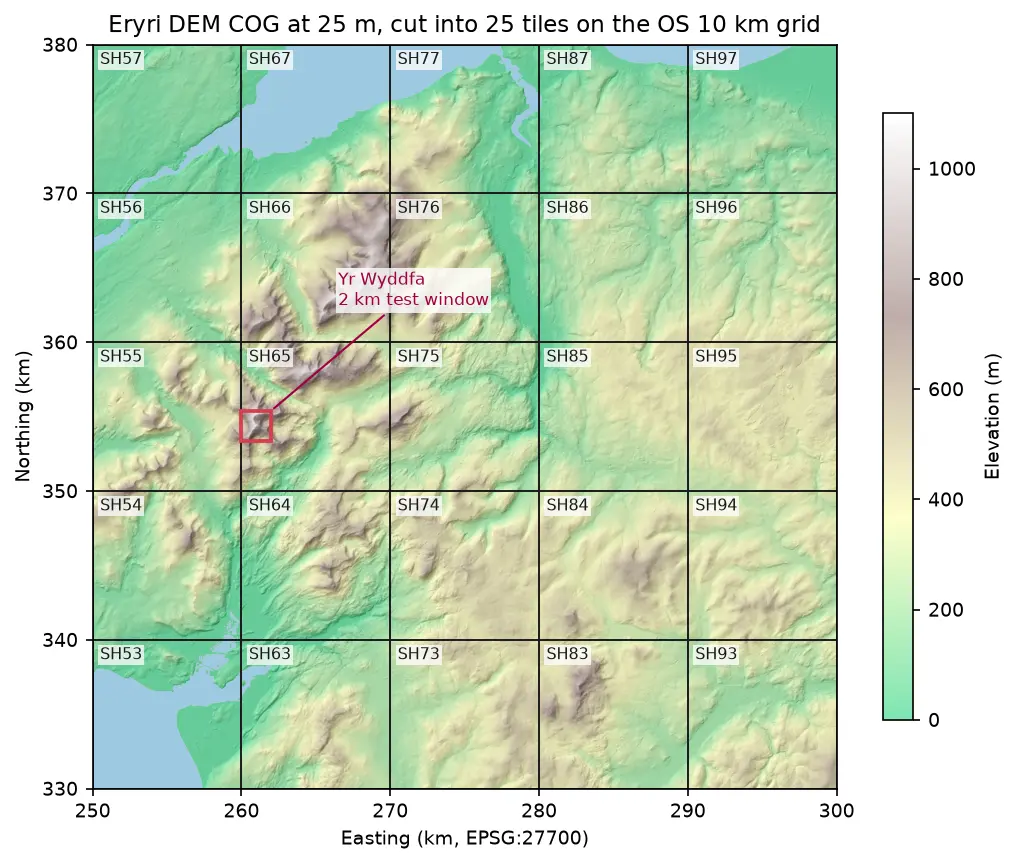
Hillshaded elevation map of Eryri at 25 m in British National Grid, coloured from green lowland to white summits, divided into 25 labelled 10 km squares from SH53 to SH97, with a red 2 km box marking the Yr Wyddfa test window

Tutorial Python Part 1 of 2

Cloud Optimised GeoTIFFs in Python: reproject, mosaic and validate a COG

Mosaic four Copernicus DEM GLO-30 tiles straight from AWS with rasterio, reproject them to British National Grid, write a validated Cloud Optimised GeoTIFF with rio-cogeo, and measure exactly how many bytes HTTP range requests fetch.
Intermediate 12 min read

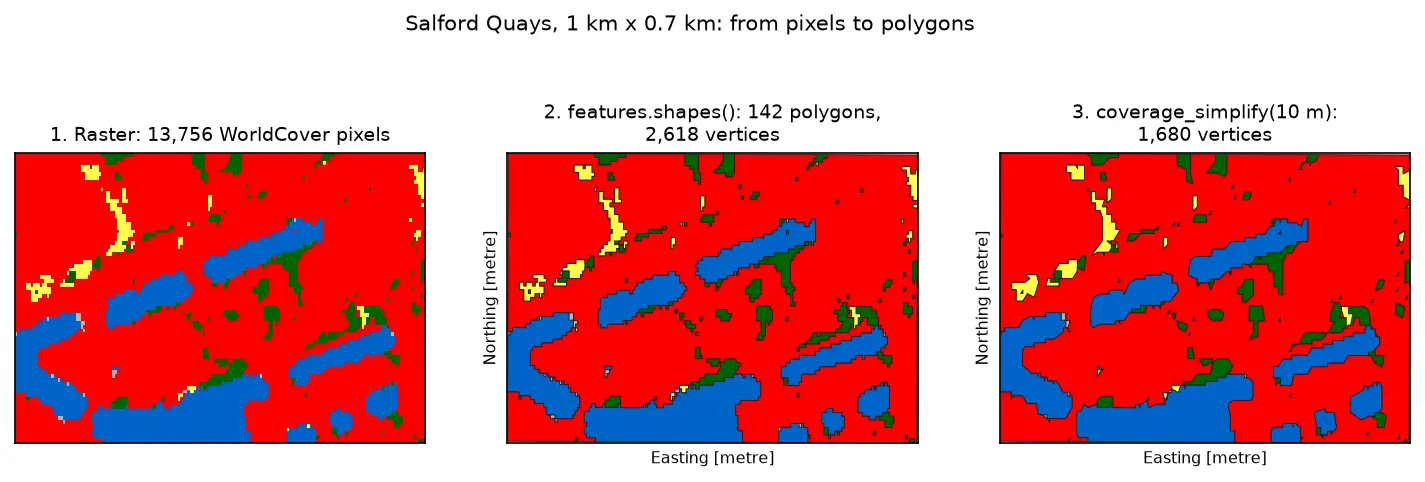
Three panels of the same 1 km by 0.7 km area at Salford Quays. Left: square WorldCover pixels, mostly red built-up land with blue dock basins and small green and yellow patches. Middle: the same area as 142 polygons with black outlines that follow the pixel staircase. Right: the polygons after coverage simplification at 10 m, with smoother outlines and no gaps between them.

Tutorial Python Part 3 of 3

Raster to vector in Python: polygonize with rasterio, rasterize boundaries and convert a GeoTIFF to a Cloud Optimized GeoTIFF

Convert raster to vector in Python with rasterio.features.shapes on 10 m ESA WorldCover for Greater Manchester: polygonize water and built-up land, fix invalid polygons, simplify without gaps, rasterize ONS district boundaries for land-cover shares, then write and validate a Cloud Optimized GeoTIFF with rio-cogeo and measure HTTP range reads.

Intermediate 14 min read

Tutorial Python

Viewshed analysis in Python: line of sight and a wind farm ZTV with GDAL and numpy

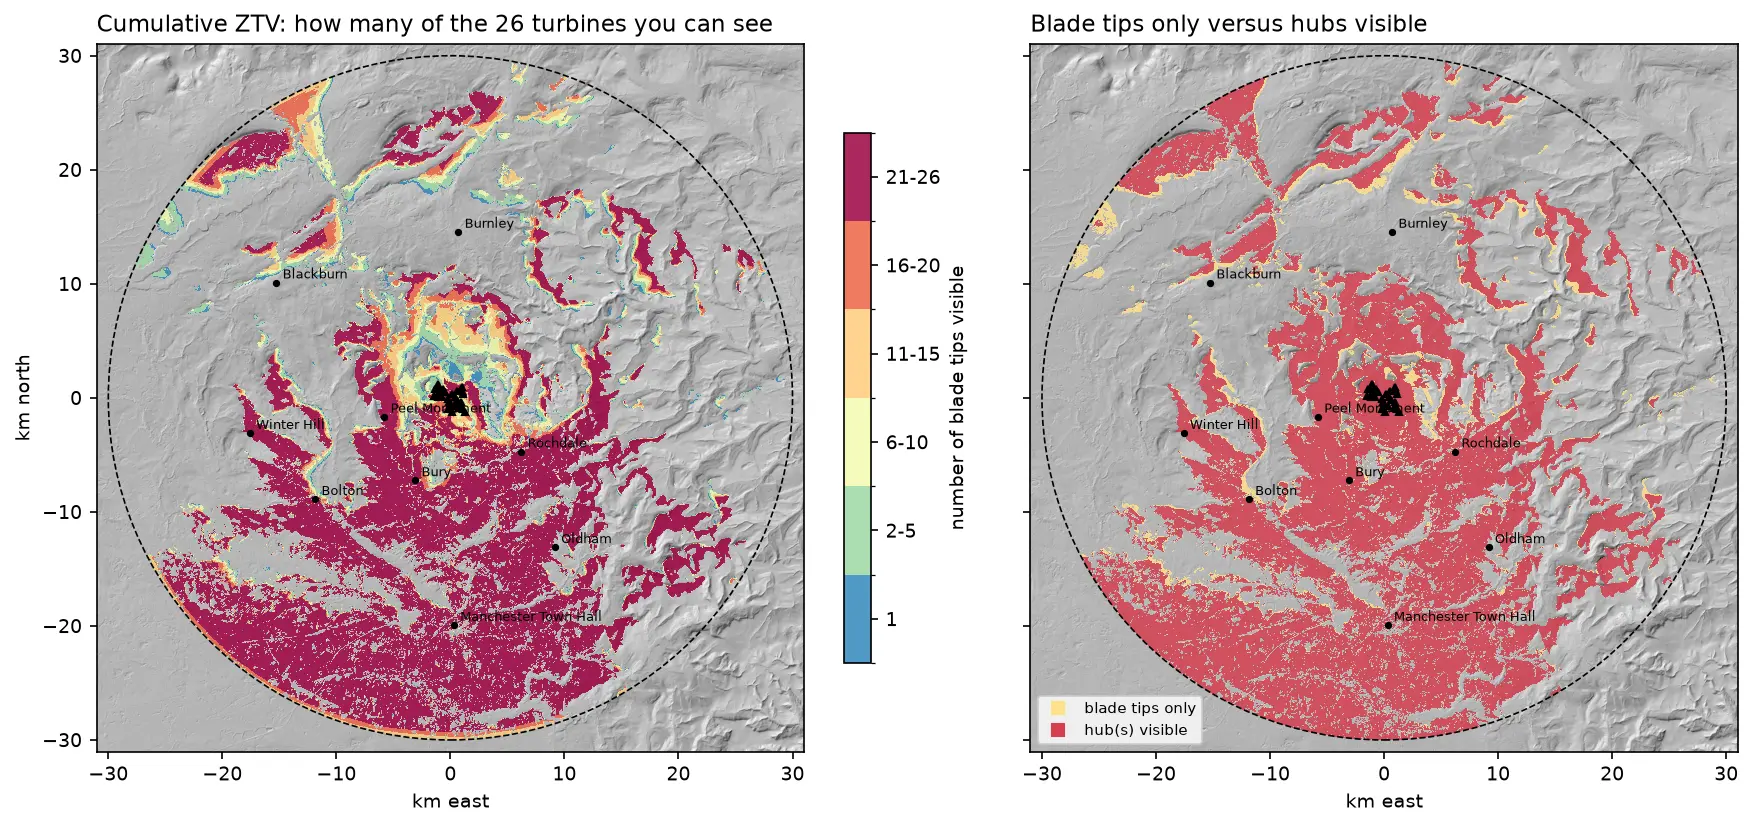
Run a viewshed analysis in Python on a real DEM: compute what one wind turbine can see with gdal.ViewshedGenerate, rebuild the same line-of-sight algorithm in numpy, correct for earth curvature and refraction, build a cumulative zone of theoretical visibility (ZTV) from 26 turbines, draw line-of-sight profiles, and measure how much trees and buildings in a LiDAR DSM shrink a bare-earth viewshed.

Intermediate 16 min read

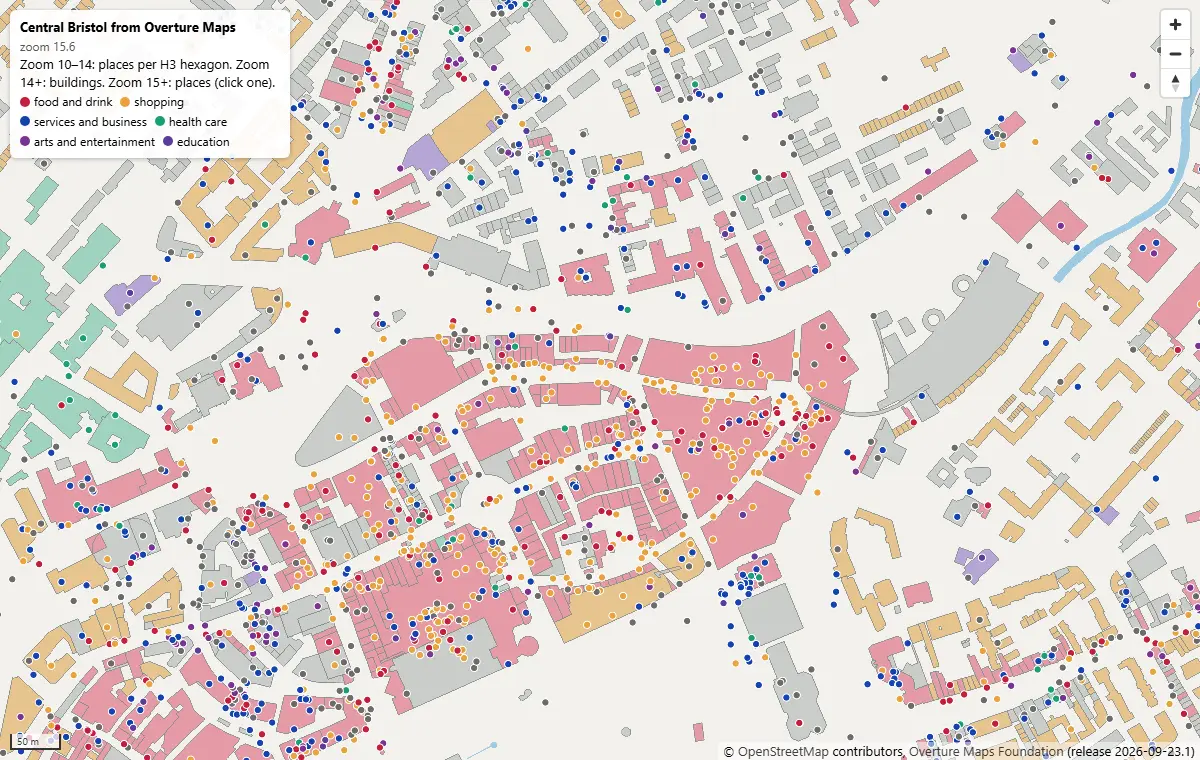
MapLibre GL JS map of central Bristol at zoom 15.6, with Overture building footprints coloured by subtype and places as coloured dots by category, around Broadmead and Cabot Circus

Tutorial Python Part 2 of 2

PMTiles vector tiles in Python and a MapLibre GL JS web map

Turn Overture Maps GeoParquet into PMTiles vector tiles with the GDAL that ships in pyogrio, no Tippecanoe needed, measure the zoom-level and size trade-offs, and serve an interactive MapLibre GL JS map of Bristol from static hosting.

Intermediate 12 min read