#Landsat

3 posts

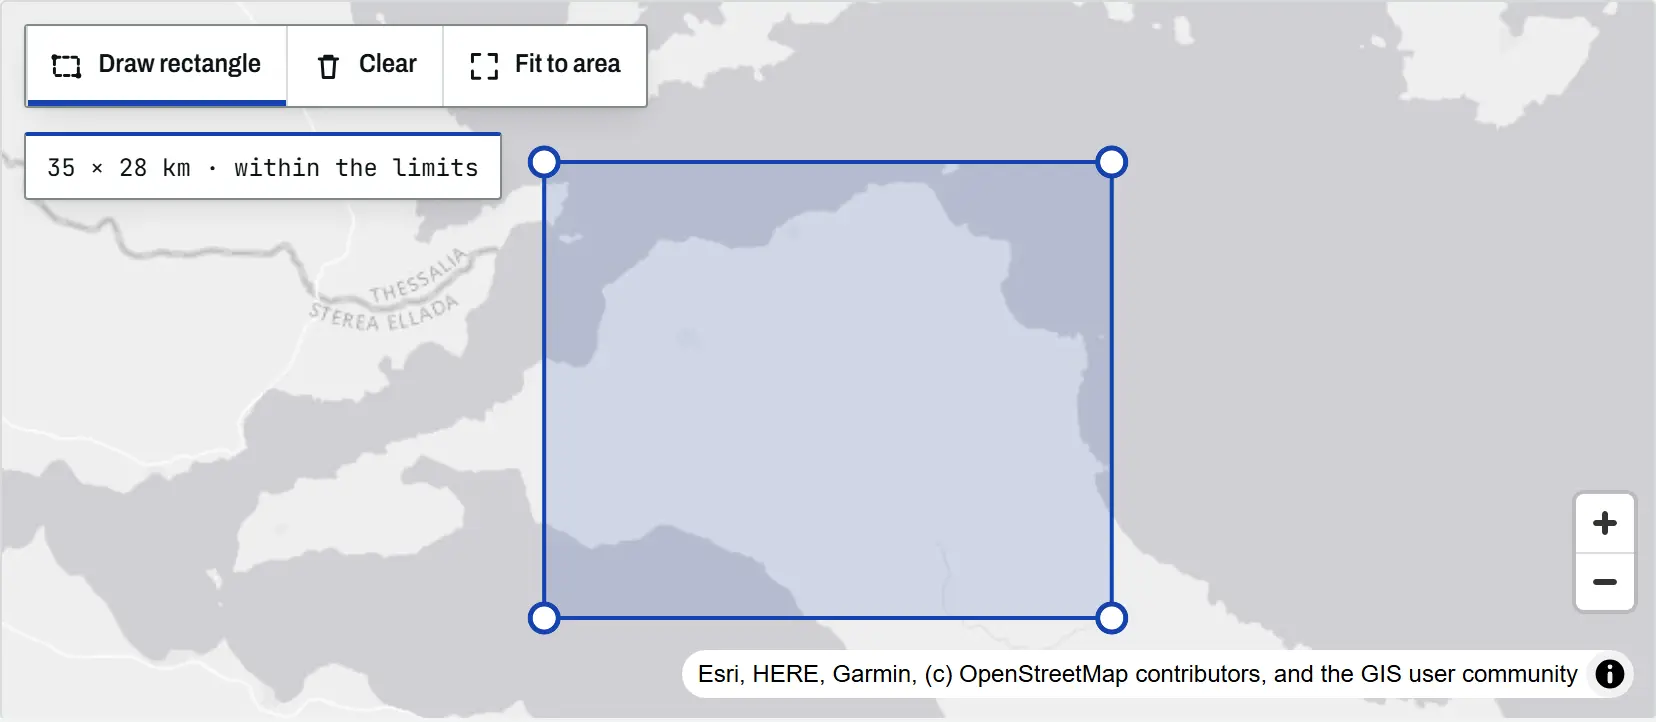
The climate tool map with a rectangle drawn over north Evia, Greece, its corner handles visible and a readout of 35 by 28 km within the limits

Article Remote Sensing

Climate time-series tools: charts and time-lapses for any place

An introduction to the TechnicalGIS climate time-series tools: five open datasets, how to draw an area on the map, worked examples from London, north Evia, Nairobi and Las Vegas, the processing limits and the terms for reusing every output.
Beginner 8 min read

Tutorial Python

Deforestation detection in Python with Global Forest Change data (Rondônia, 2001–2025)

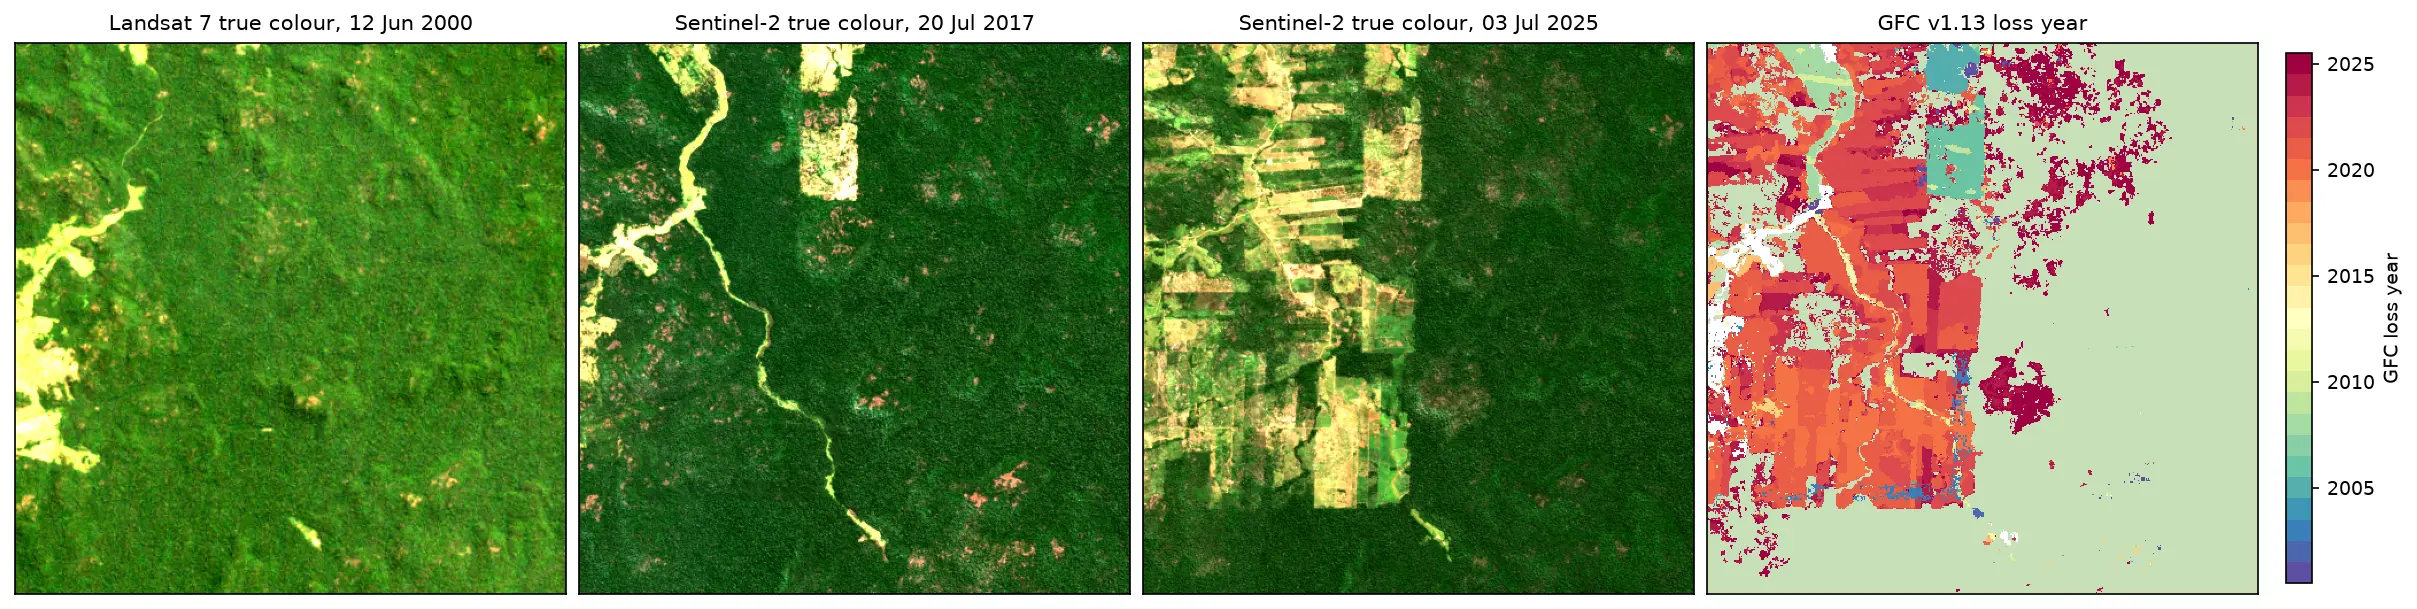
Map forest loss and deforestation in Python with the Hansen/UMD Global Forest Change v1.13 data: read the open tiles with no login, compute loss by year in hectares with correct pixel areas, compare Landsat and Sentinel-2 images before and after, and check the GFC loss year against Sentinel-2 NBR and MODIS burned area for central Rondônia, Brazil.

Intermediate 15 min read

Tutorial Python

Land surface temperature from Landsat in Python: mapping London's urban heat island

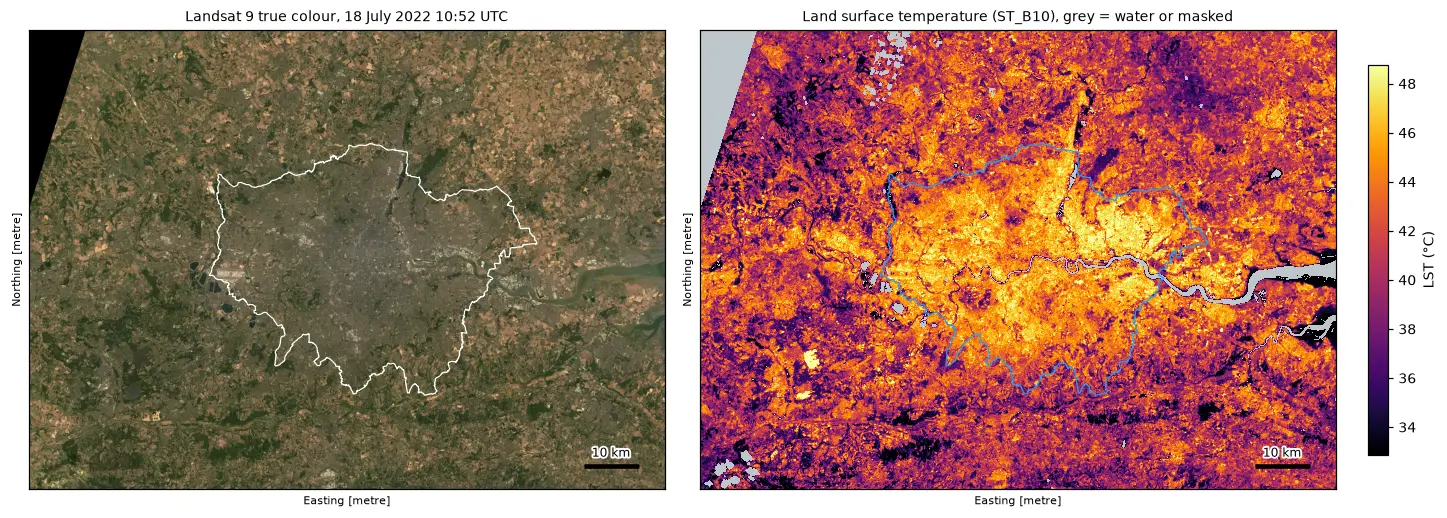
Calculate land surface temperature from Landsat 8 and 9 Collection 2 Level-2 data in Python: ST_B10 scale and offset, QA_PIXEL cloud masking, LST by land cover and NDVI, an urban-rural transect, hotspots with OpenStreetMap and an honest comparison with air temperature, for London in the July 2022 heatwave.

Intermediate 17 min read