#MODIS

7 posts

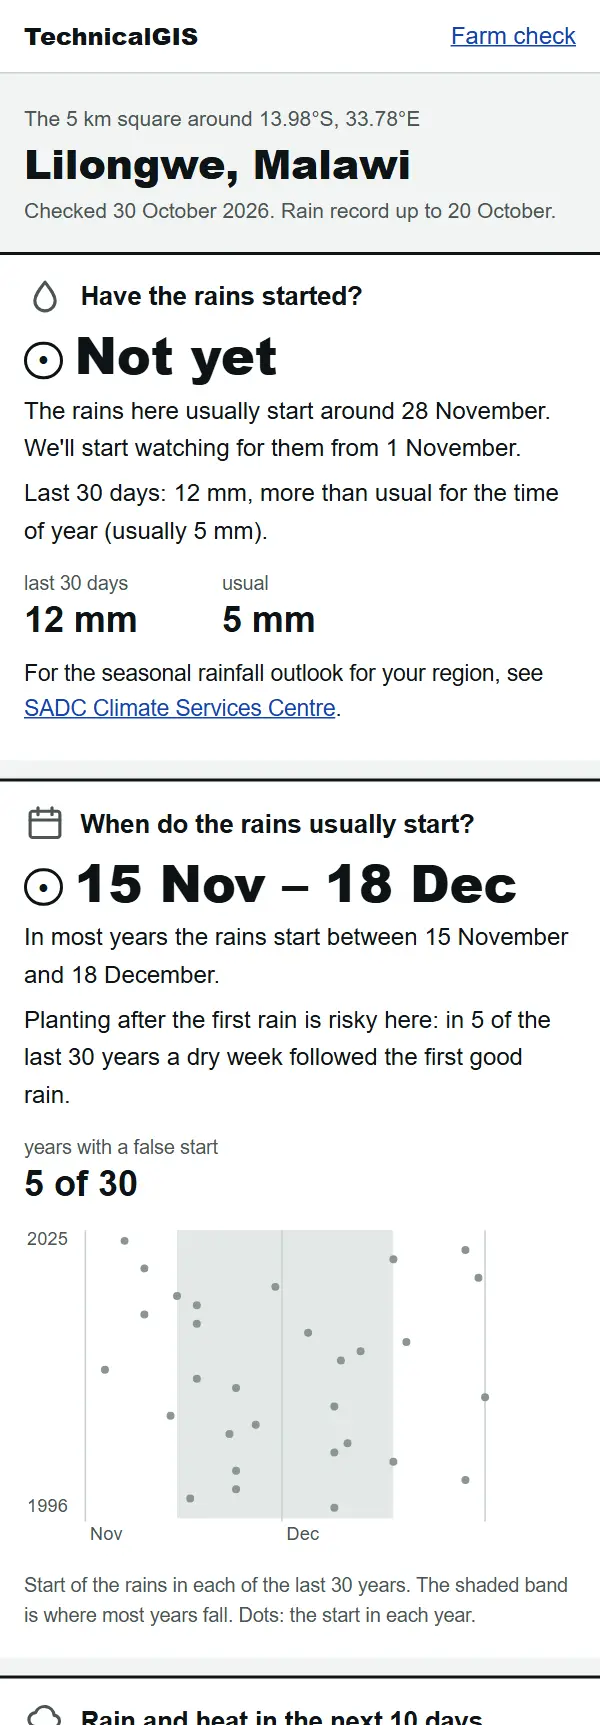
Farm check answer for Lilongwe, Malawi, on 30 October 2026: the rains have not started yet and usually start between 15 November and 18 December

Article Remote Sensing

Farm check: has the rain started on your farm?

A free, phone-friendly check for any farm: whether the rains have started, when they usually start, rain and heat for the next 10 days and how green the crops are. Examples from Lilongwe, Malawi, and Gazipur, Bangladesh.
Beginner 5 min read

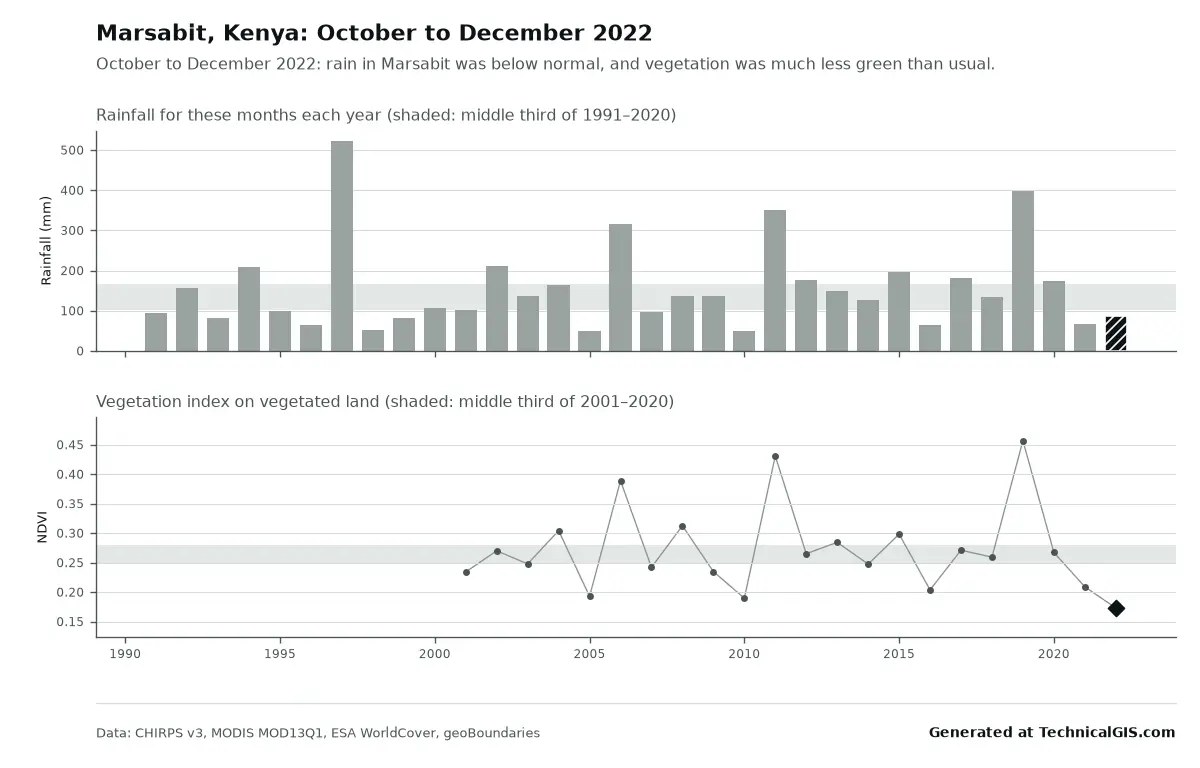
Season condition answer for Marsabit, Kenya, October to December 2022, with rainfall below normal and vegetation the lowest since 2001

Article Remote Sensing

Free community tools: season condition and flood impact for any district

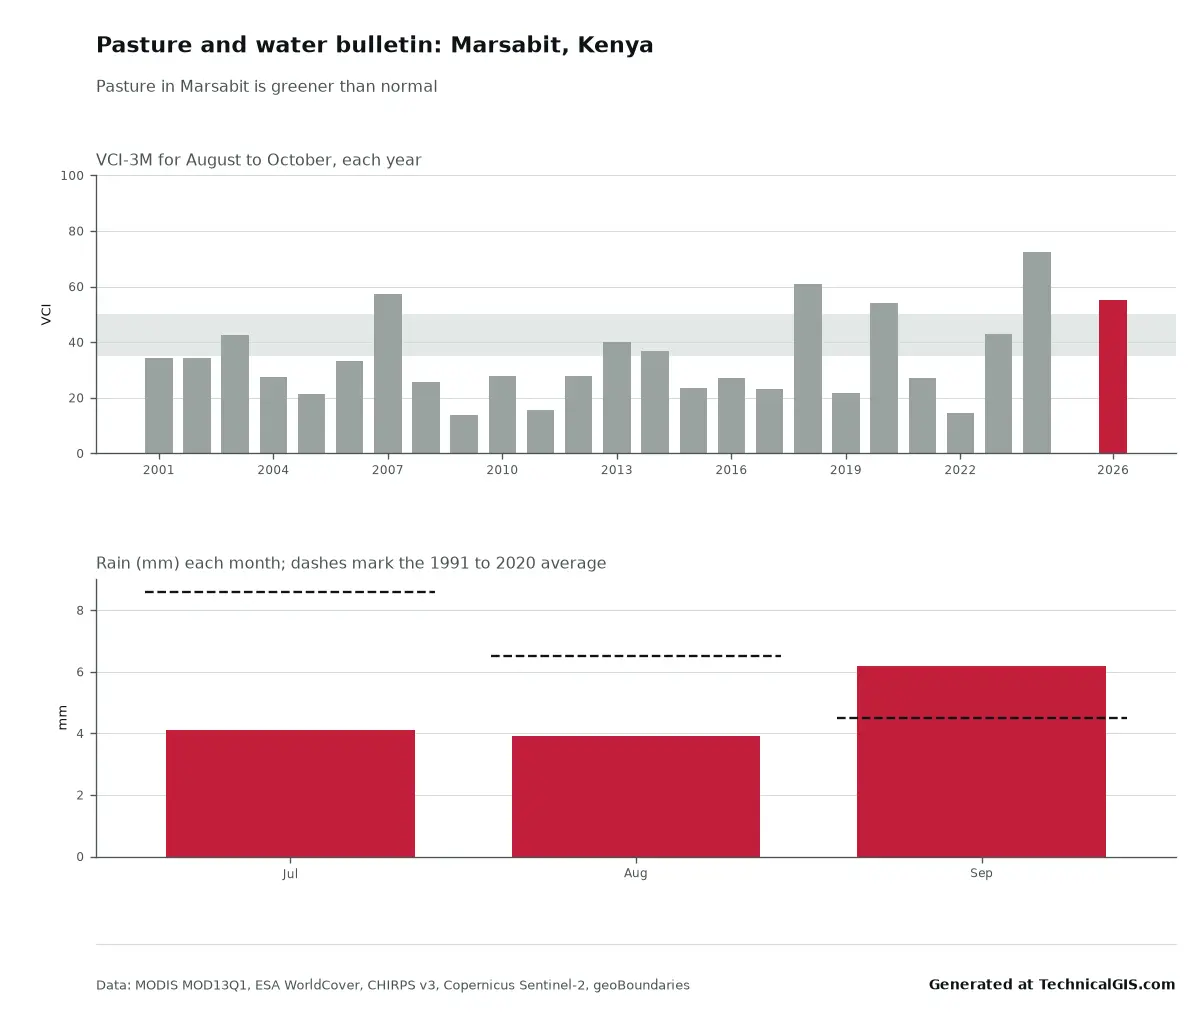
Two free tools for any district: is this season's rain and crop growth better or worse than usual, and where did it flood and how many people live there? Worked examples from Marsabit, Kenya, in 2022 and Feni, Bangladesh, in 2024.

Beginner 5 min read

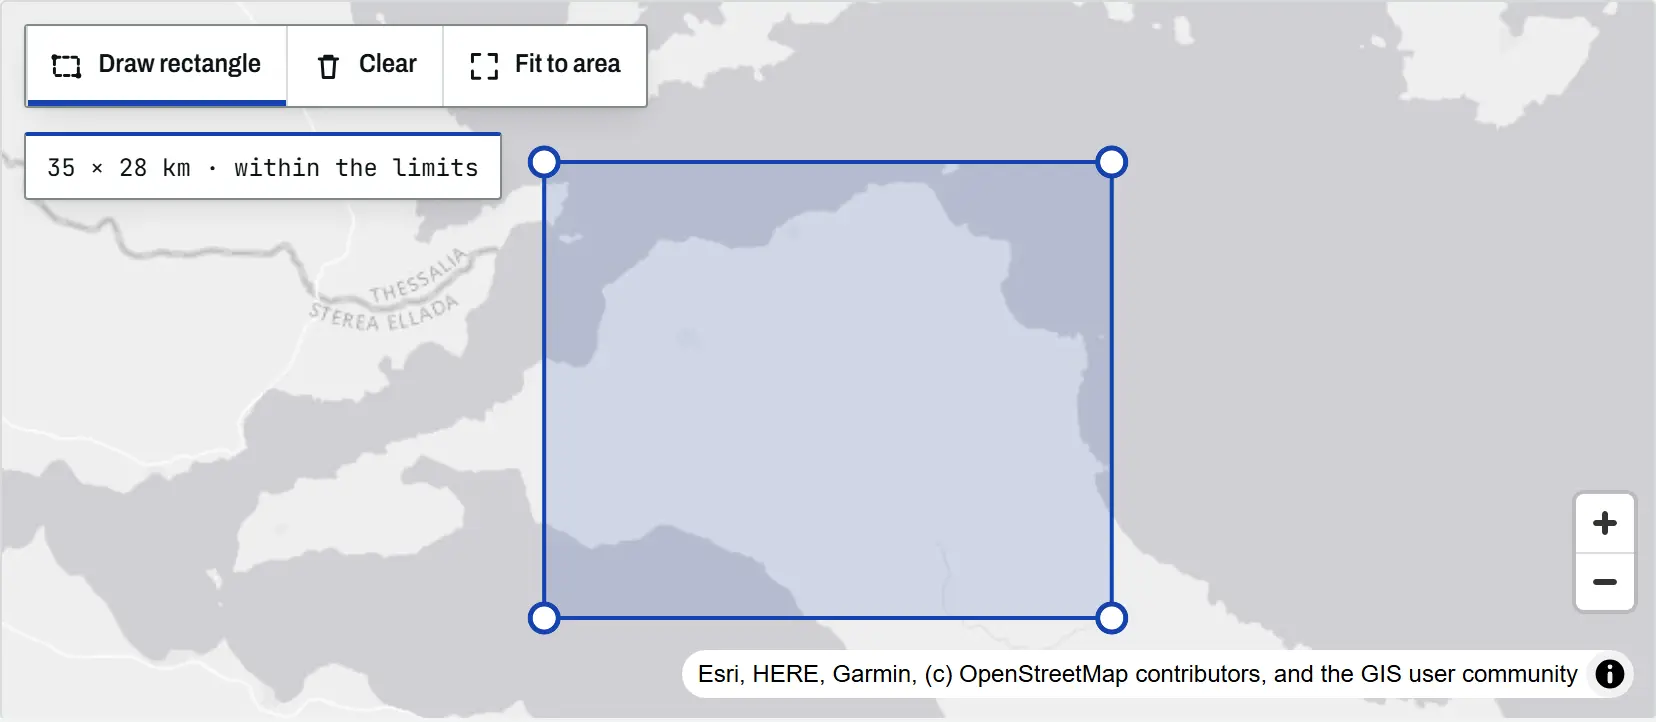
The climate tool map with a rectangle drawn over north Evia, Greece, its corner handles visible and a readout of 35 by 28 km within the limits

Article Remote Sensing

Climate time-series tools: charts and time-lapses for any place

An introduction to the TechnicalGIS climate time-series tools: five open datasets, how to draw an area on the map, worked examples from London, north Evia, Nairobi and Las Vegas, the processing limits and the terms for reusing every output.

Beginner 8 min read

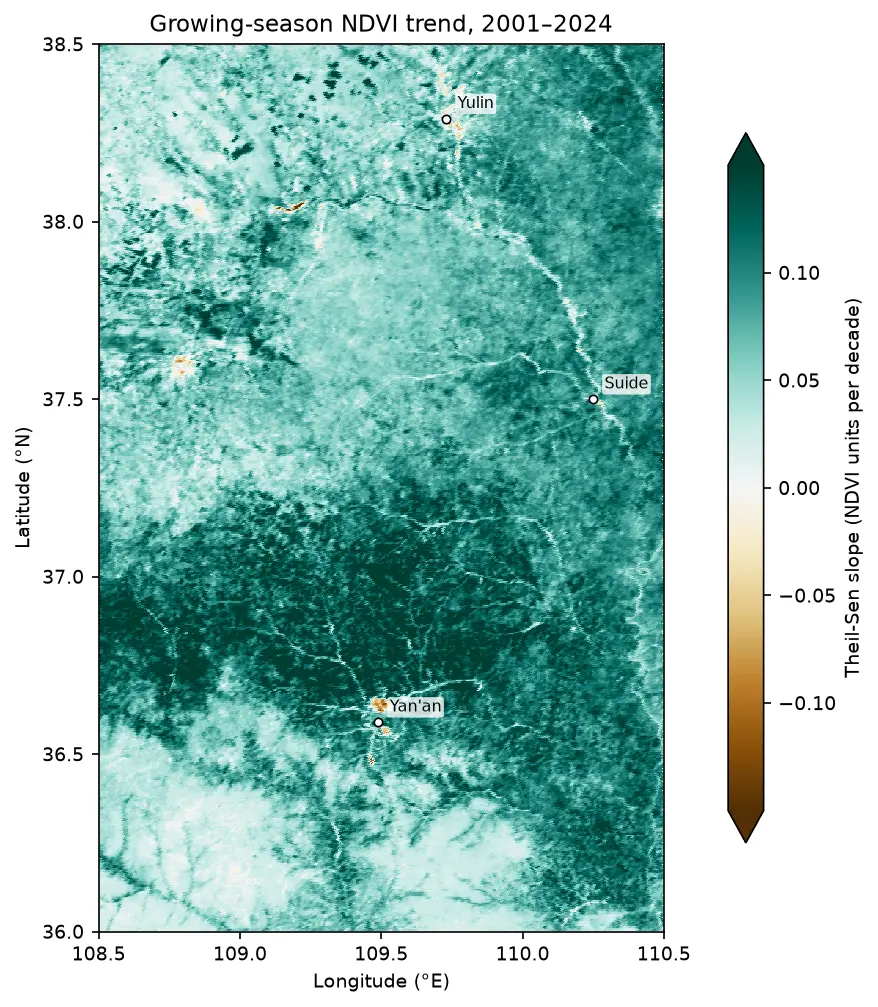
Map of the Theil-Sen slope of growing-season NDVI from 2001 to 2024 on the Loess Plateau between Yan'an and Yulin, almost entirely teal (greening), with a few brown browning patches near Yan'an and Yulin.

Tutorial Remote Sensing

Mann-Kendall trend test on rasters in Python: Theil-Sen NDVI trends with xarray

Run a pixel-wise Mann-Kendall trend test and Theil-Sen slope on 24 years of MODIS NDVI in Python. Read MOD13A1 from the Microsoft Planetary Computer, mask it with the QA layer, aggregate to growing-season means, vectorise the tests with xarray.apply_ufunc (checked against pymannkendall), compare the seasonal and modified Mann-Kendall tests, control the false discovery rate across 229,229 pixels, and map greening and browning on China's Loess Plateau.

Advanced 16 min read

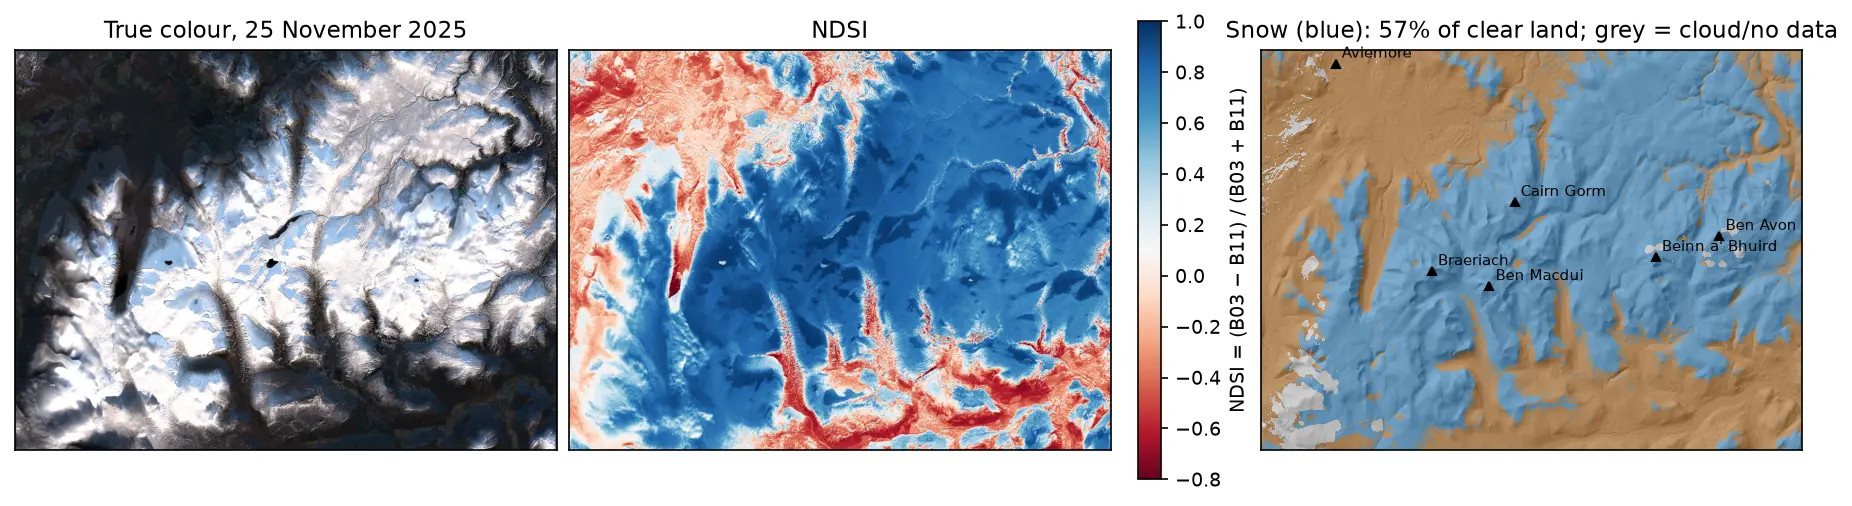
Three panels of the Cairngorms on 25 November 2025: a true-colour Sentinel-2 image with snow on the plateaux and long shadows in the glens; the NDSI, blue over snow and red over forest and bare ground; and a snow map over hillshade, with snow in blue on the high ground around Cairn Gorm, Ben Macdui, Braeriach, Beinn a' Bhuird and Ben Avon, covering 57% of the clear land.

Tutorial Python

Snow cover mapping with NDSI in Python: Sentinel-2 and MODIS over the Cairngorms

Map snow cover in Python with the Normalised Difference Snow Index (NDSI) from Sentinel-2 and the daily MODIS snow product on the Microsoft Planetary Computer: choosing the NDSI threshold, separating snow from cloud, snow-covered area through the winter of 2025–26 in the Cairngorms, and the snowline by elevation and aspect with the Copernicus DEM.

Intermediate 15 min read

Tutorial Python

Deforestation detection in Python with Global Forest Change data (Rondônia, 2001–2025)

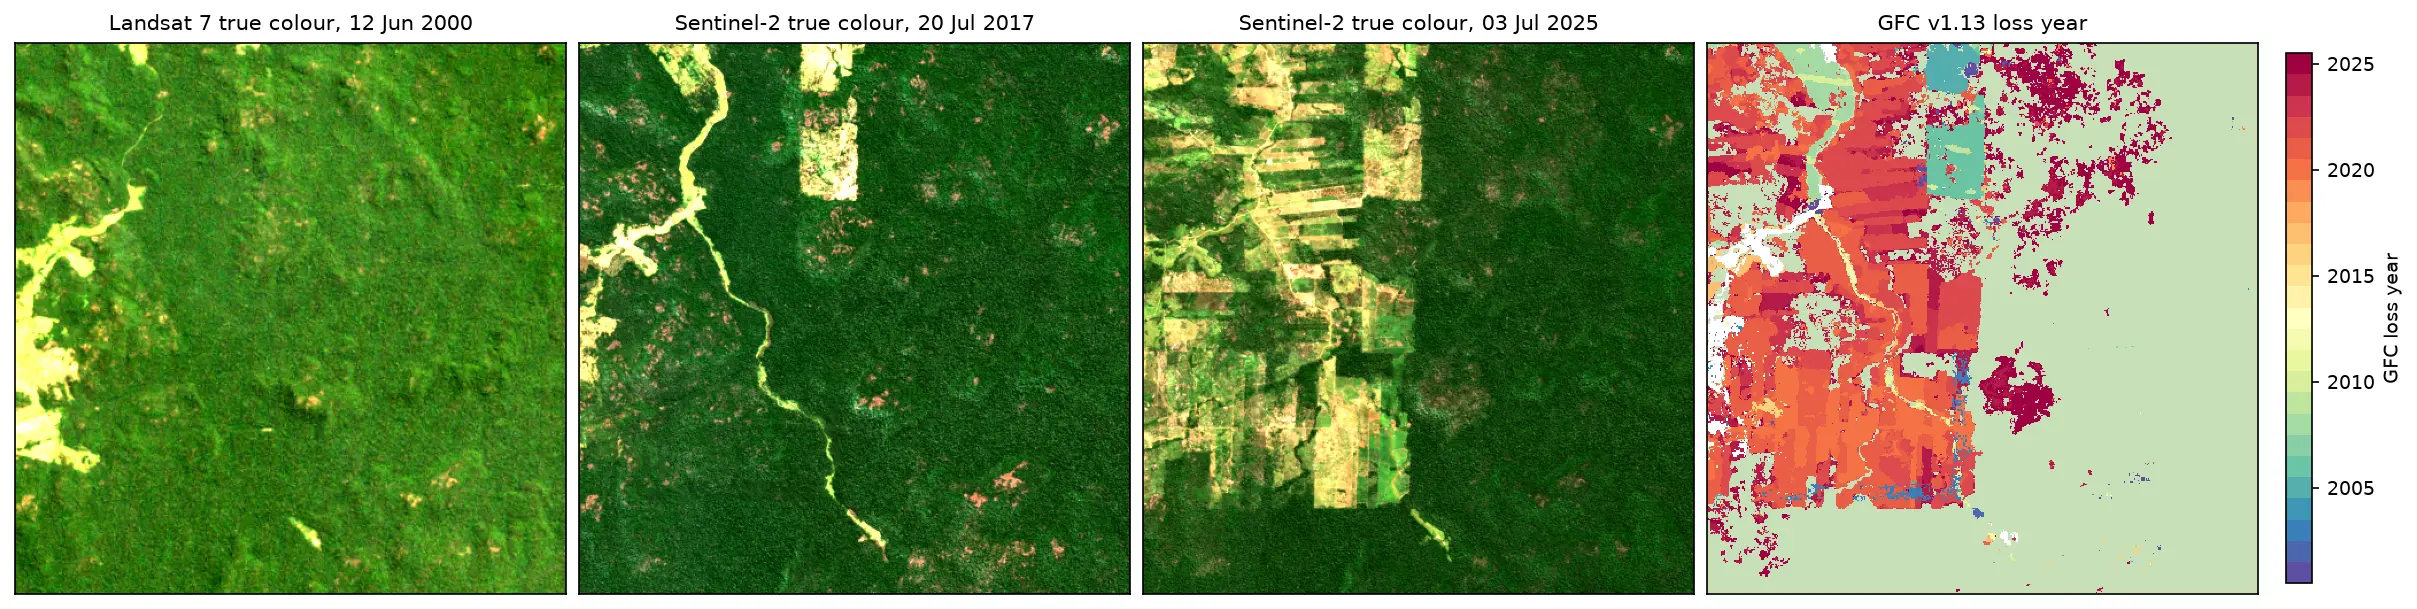
Map forest loss and deforestation in Python with the Hansen/UMD Global Forest Change v1.13 data: read the open tiles with no login, compute loss by year in hectares with correct pixel areas, compare Landsat and Sentinel-2 images before and after, and check the GFC loss year against Sentinel-2 NBR and MODIS burned area for central Rondônia, Brazil.

Intermediate 15 min read