#Network analysis

3 posts

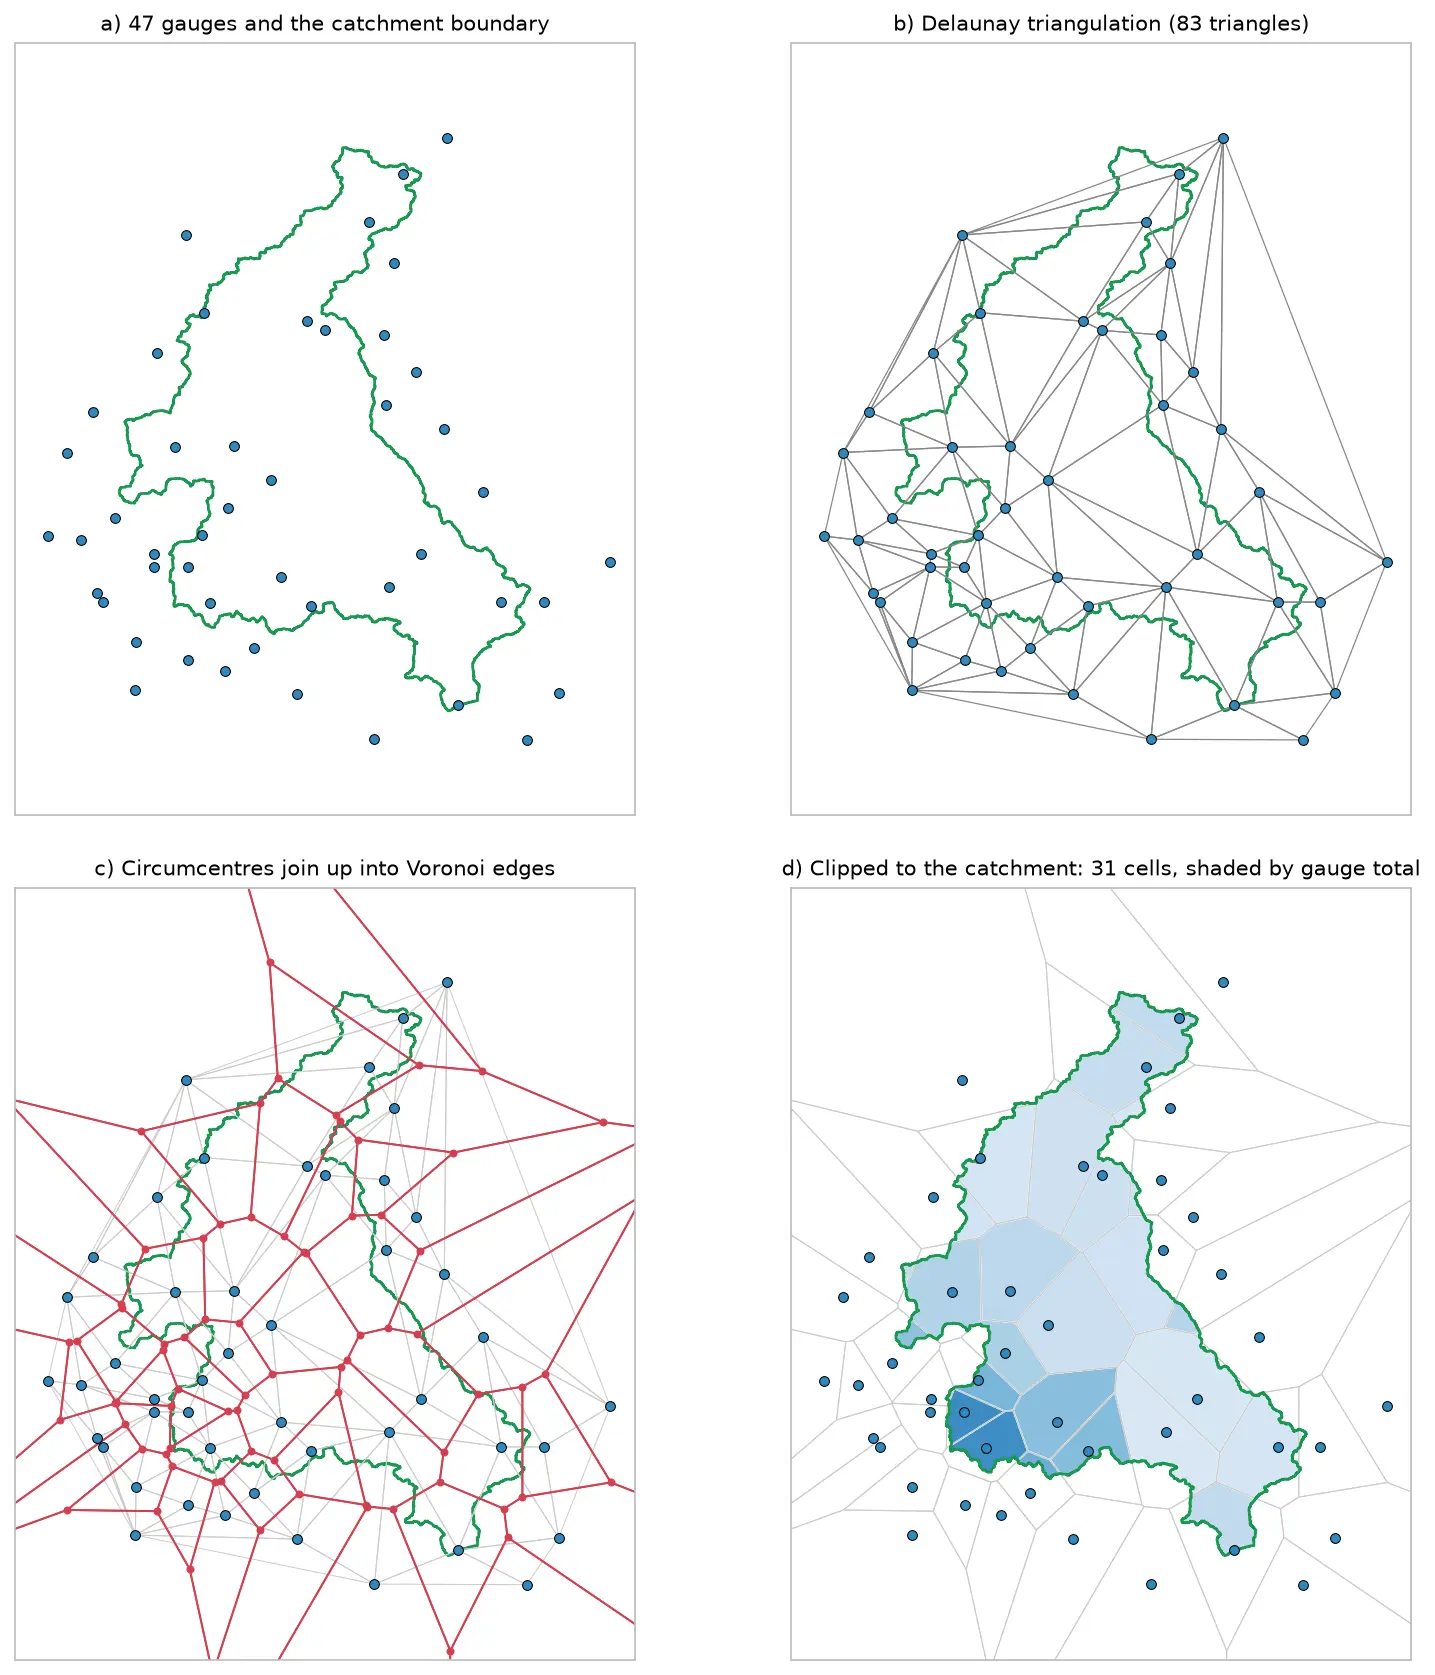
Four panels showing how Voronoi polygons are built for 47 rain gauges around the River Eden catchment: the gauges and the catchment outline, their Delaunay triangulation, the triangle circumcentres joined into red Voronoi edges, and the cells clipped to the catchment and shaded by each gauge's rainfall.

Tutorial Python

Voronoi (Thiessen) polygons in Python: catchment rainfall from EA rain gauges and fire station areas in Cumbria

Build Voronoi (Thiessen) polygons in Python with shapely and GeoPandas, clipped to a real boundary. Compute Thiessen-weighted catchment rainfall for the River Eden from Environment Agency rain gauge readings, check the gauges, compare with the gauge average and IDW, then compare Voronoi 'nearest fire station' areas in Cumbria with drive-time service areas from OpenStreetMap.
Intermediate 15 min read

Tutorial Python Part 2 of 2

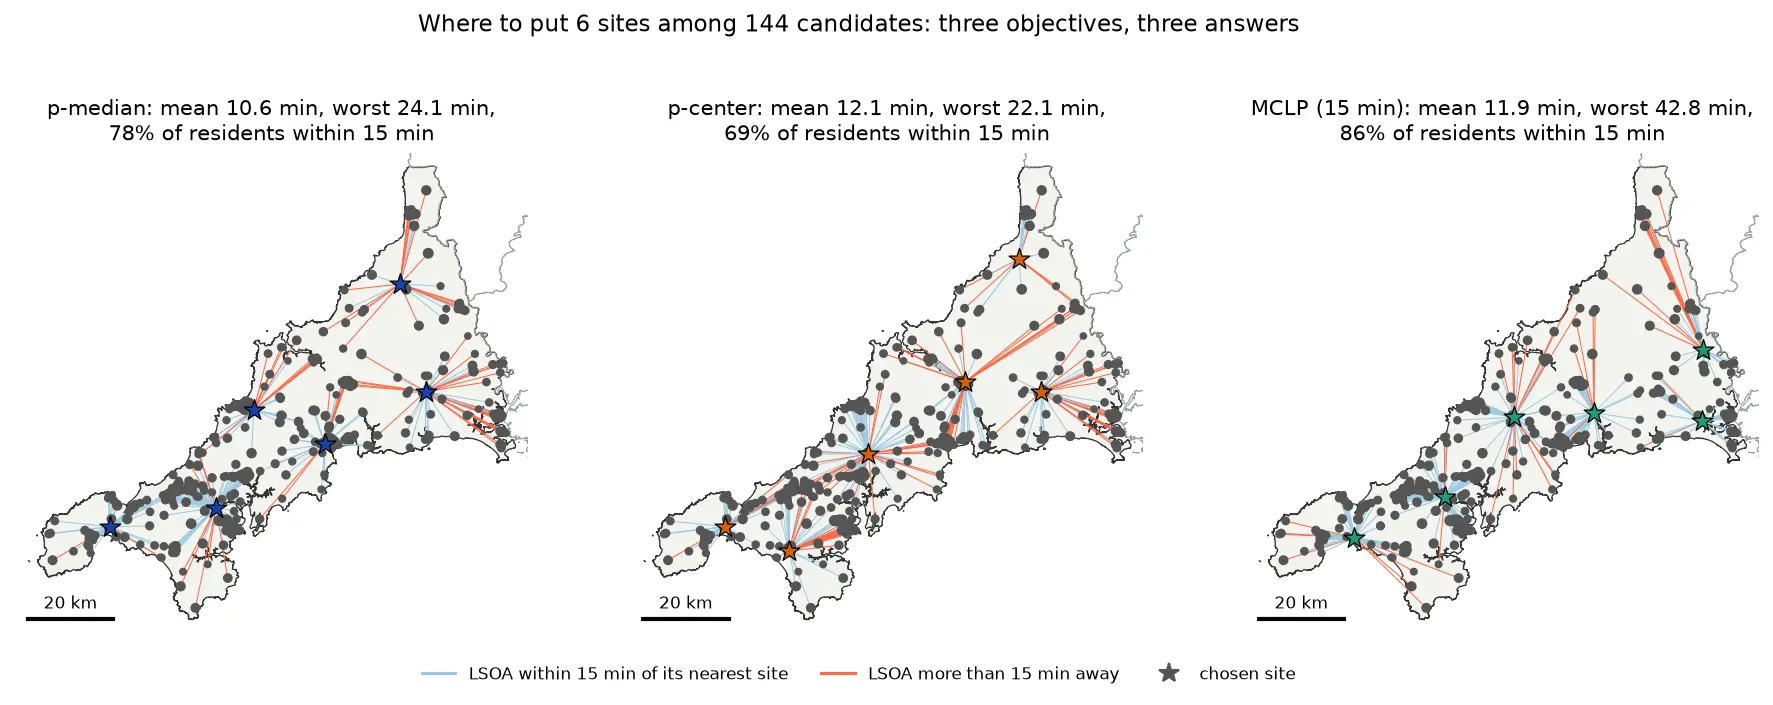
Location-allocation in Python: p-median, p-center and maximal covering (MCLP) with spopt

Solve location-allocation problems in Python with spopt and the CBC solver: the p-median, p-center and maximal covering location problem (MCLP). Choose sites for new urgent-care or mobile clinic bases among Cornwall's community buildings, on OSMnx drive times and Census 2021 population, compare the three answers on maps and charts, draw the trade-off curve as the number of sites grows, and see how problem size drives solve time.

Intermediate 17 min read

Tutorial Python Part 1 of 2

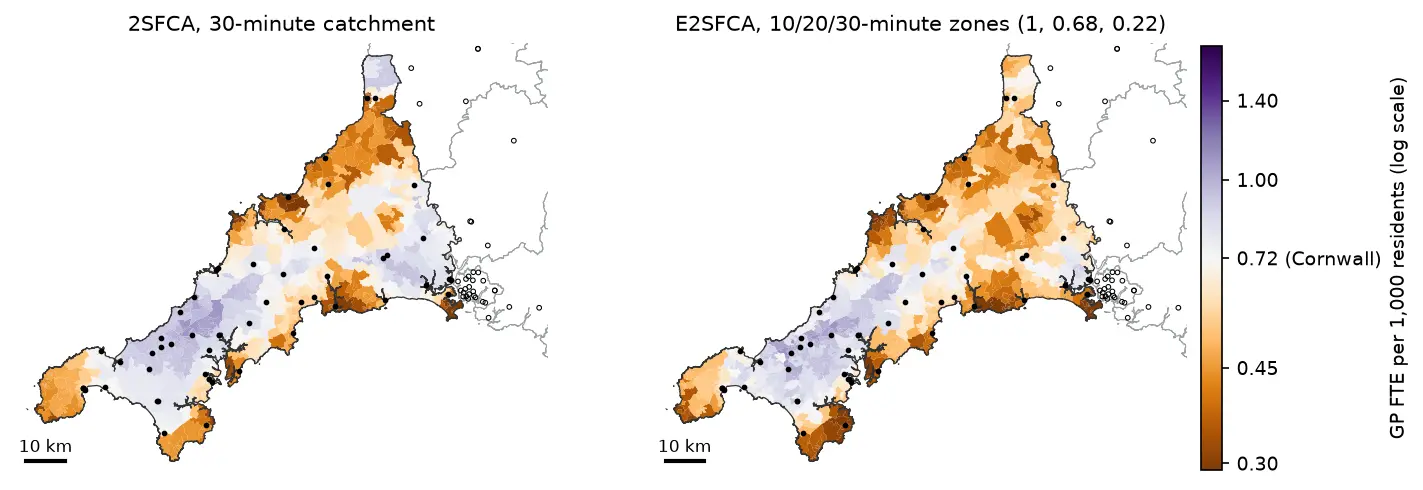
Two-step floating catchment area (2SFCA) in Python: spatial access to GP practices in Cornwall

Measure spatial accessibility to GP practices in Python with the two-step floating catchment area (2SFCA) method and its distance-decay version (E2SFCA). Build OSMnx drive times for Cornwall from OpenStreetMap, use NHS GP workforce data and Census 2021 population, compare the PySAL access package with a vectorised NumPy version, and test the catchment threshold, the decay function and edge effects.

Intermediate 18 min read