#rasterio

10 posts

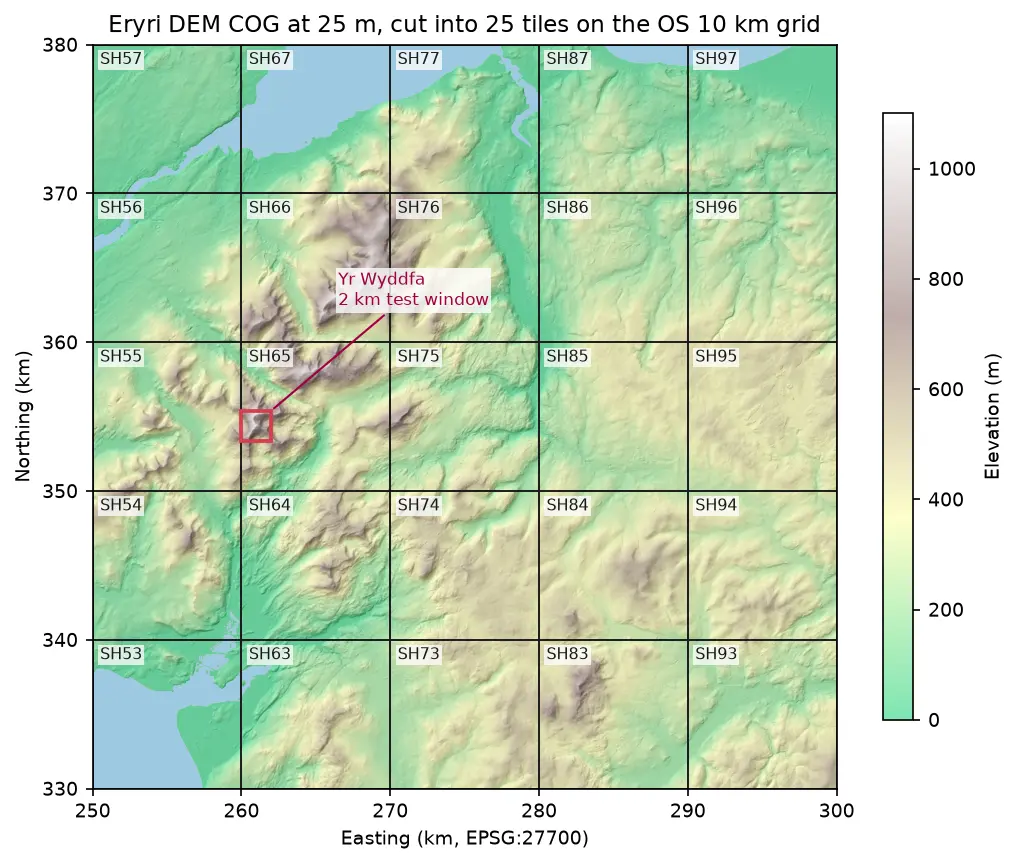
Hillshaded elevation map of Eryri at 25 m in British National Grid, coloured from green lowland to white summits, divided into 25 labelled 10 km squares from SH53 to SH97, with a red 2 km box marking the Yr Wyddfa test window

Tutorial Python Part 1 of 2

Cloud Optimised GeoTIFFs in Python: reproject, mosaic and validate a COG

Mosaic four Copernicus DEM GLO-30 tiles straight from AWS with rasterio, reproject them to British National Grid, write a validated Cloud Optimised GeoTIFF with rio-cogeo, and measure exactly how many bytes HTTP range requests fetch.
Intermediate 12 min read

Tutorial Python Part 2 of 2

Kernel density estimation in Python for GIS: bandwidths, GeoTIFF heatmaps and relative risk

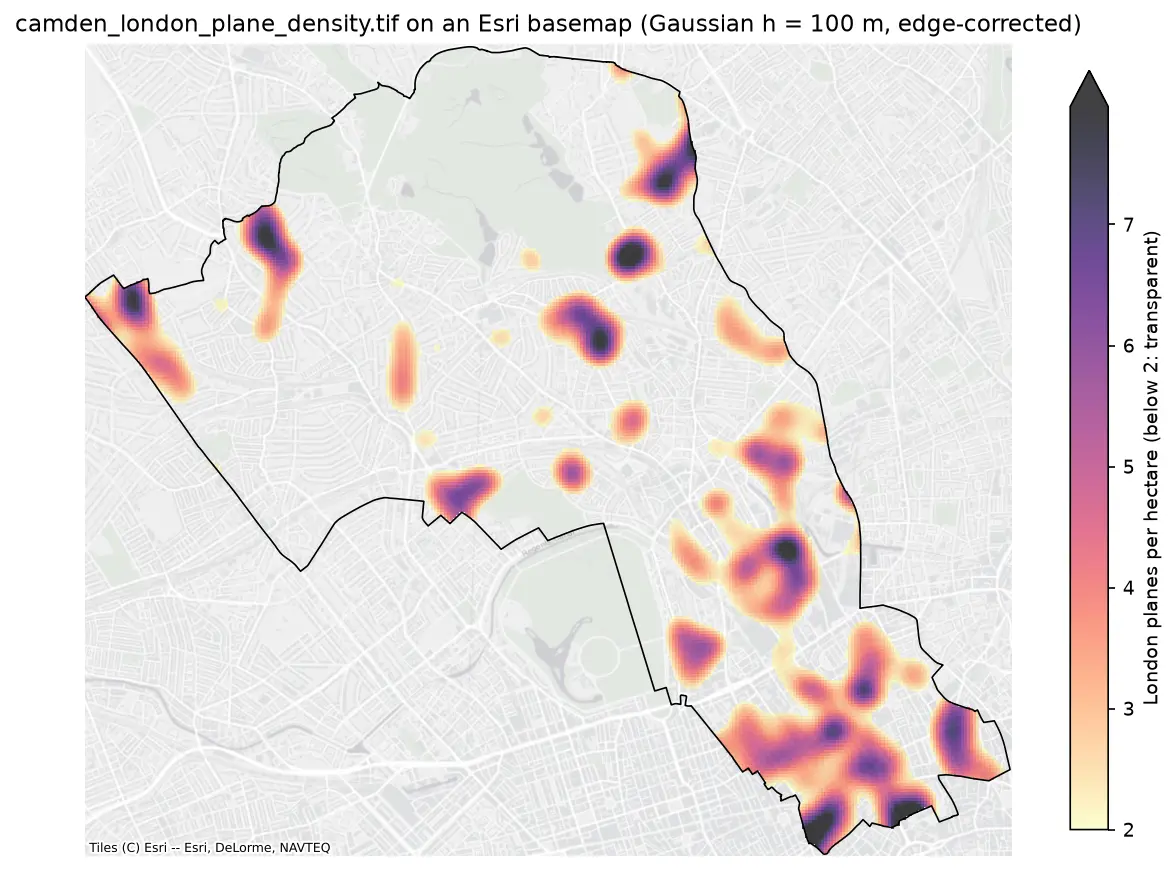
Make a kernel density heatmap from points in Python: compare Scott/Silverman, likelihood cross-validation and a fixed planning distance, Gaussian and Epanechnikov kernels and sample weights, export an edge-corrected GeoTIFF with rasterio, show it on a basemap, and map case-control relative risk on Camden's London plane trees.

Intermediate 16 min read

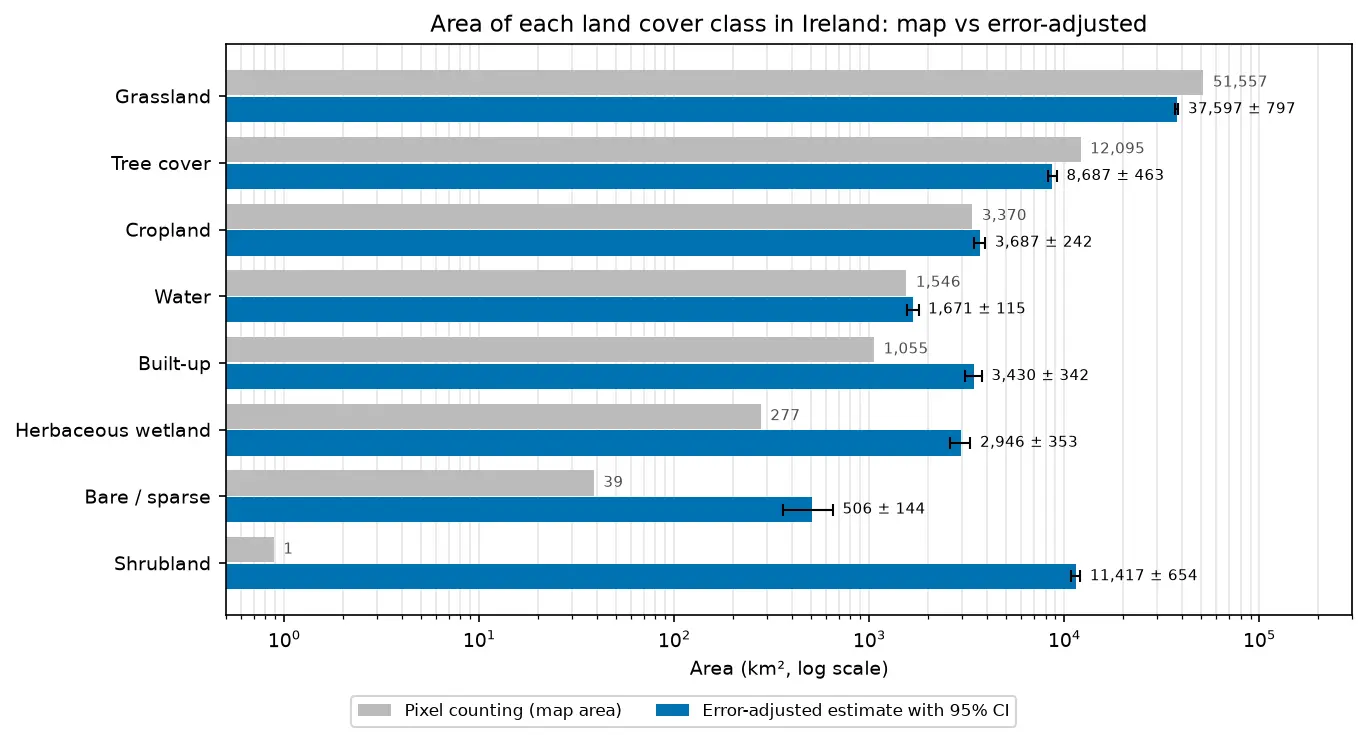
Bar chart comparing the area of each land cover class in Ireland from WorldCover pixel counting with the error-adjusted estimate and its 95% confidence interval.

Tutorial Remote Sensing

Land cover accuracy assessment in Python: confusion matrix, Olofsson area estimates and sample size

Assess a real land cover map in Python: ESA WorldCover 2021 against 8,597 Eurostat LUCAS 2022 field survey points in Ireland. Build the confusion matrix, compute overall, user's and producer's accuracy, see why kappa is discouraged, and use the Olofsson et al. (2014) stratified estimators to get error-adjusted areas with 95% confidence intervals and to plan a new stratified random sample.

Advanced 20 min read

Tutorial Python

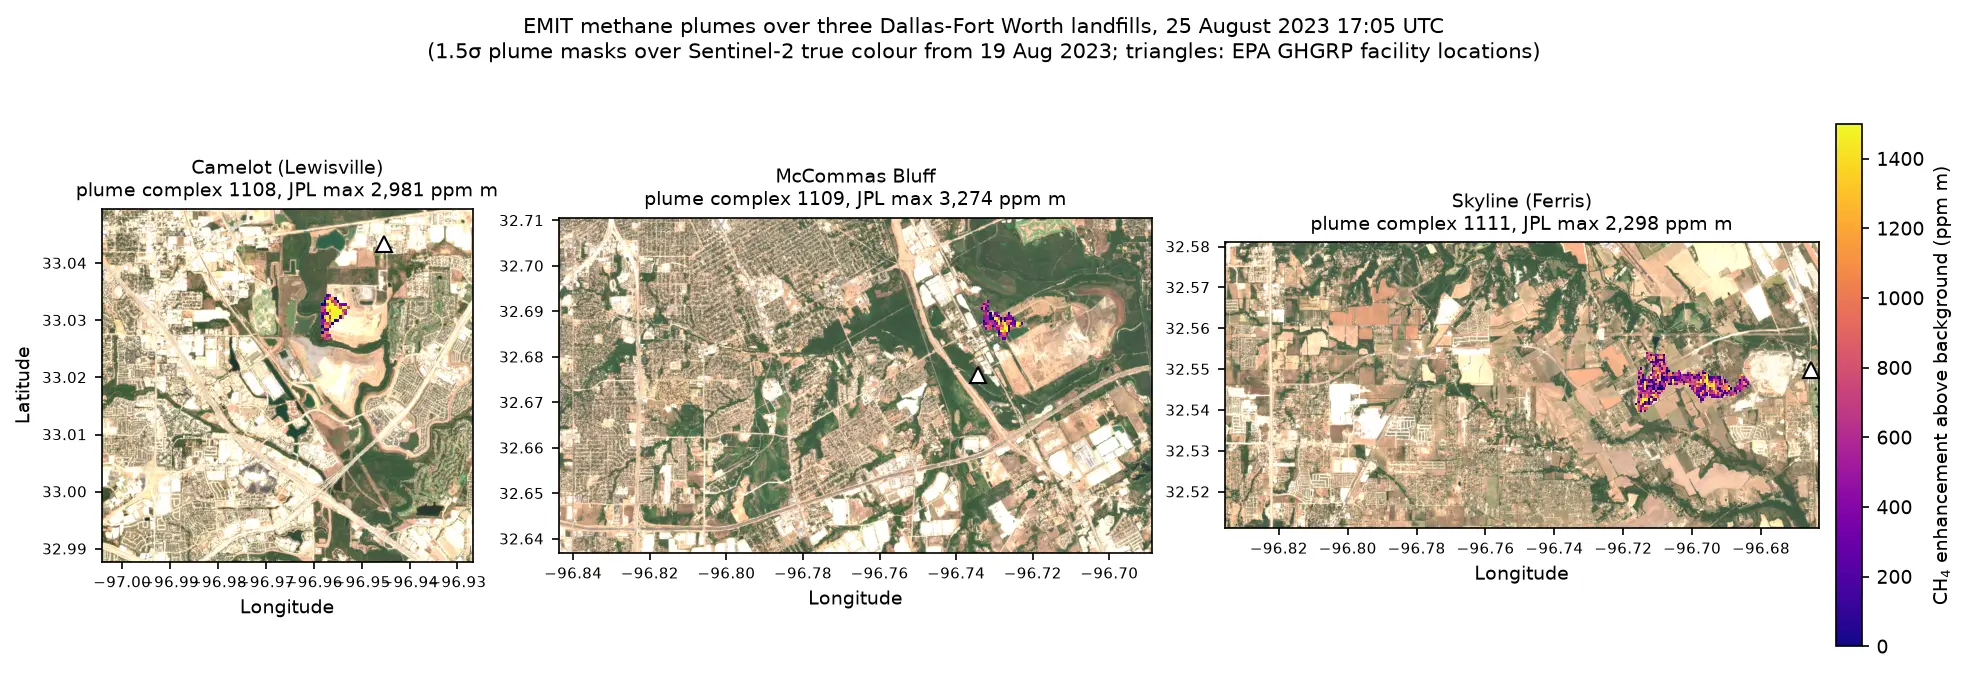
Methane plume detection in Python with NASA EMIT: mapping and quantifying landfill plumes

Detect and quantify methane plumes in Python with NASA's EMIT imaging spectrometer: load open EMIT methane enhancement data from NASA VEDA without a login, separate three Dallas-Fort Worth landfill plumes from the noise, compute the integrated mass enhancement, estimate emission rates with ERA5 winds, and compare them with EPA greenhouse gas inventory figures.

Advanced 17 min read

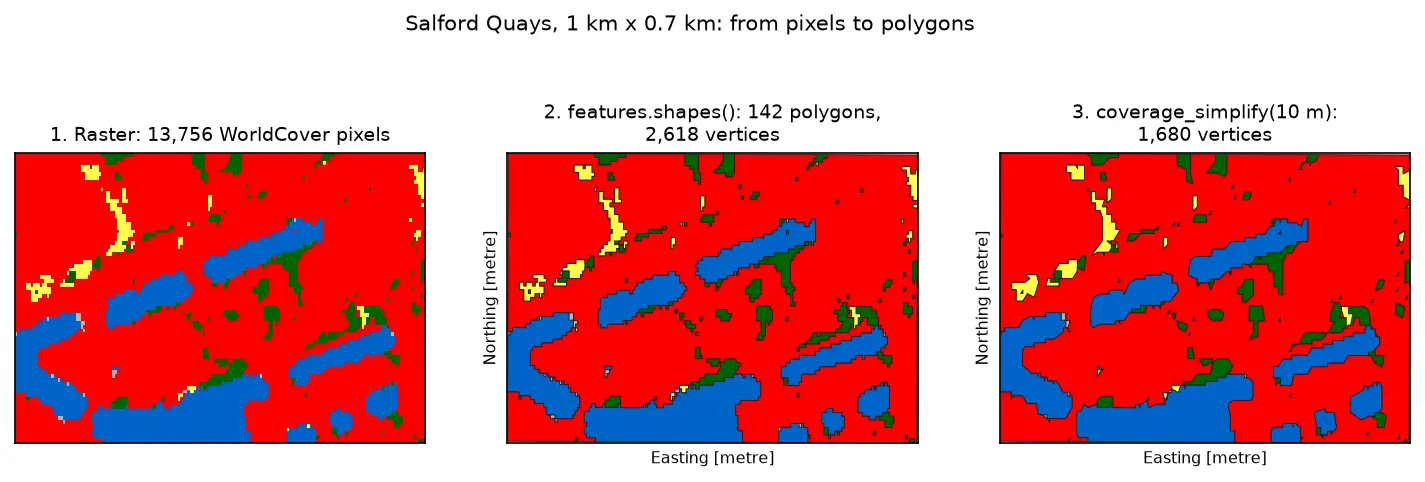
Three panels of the same 1 km by 0.7 km area at Salford Quays. Left: square WorldCover pixels, mostly red built-up land with blue dock basins and small green and yellow patches. Middle: the same area as 142 polygons with black outlines that follow the pixel staircase. Right: the polygons after coverage simplification at 10 m, with smoother outlines and no gaps between them.

Tutorial Python Part 3 of 3

Raster to vector in Python: polygonize with rasterio, rasterize boundaries and convert a GeoTIFF to a Cloud Optimized GeoTIFF

Convert raster to vector in Python with rasterio.features.shapes on 10 m ESA WorldCover for Greater Manchester: polygonize water and built-up land, fix invalid polygons, simplify without gaps, rasterize ONS district boundaries for land-cover shares, then write and validate a Cloud Optimized GeoTIFF with rio-cogeo and measure HTTP range reads.

Intermediate 14 min read

Tutorial Python Part 1 of 3

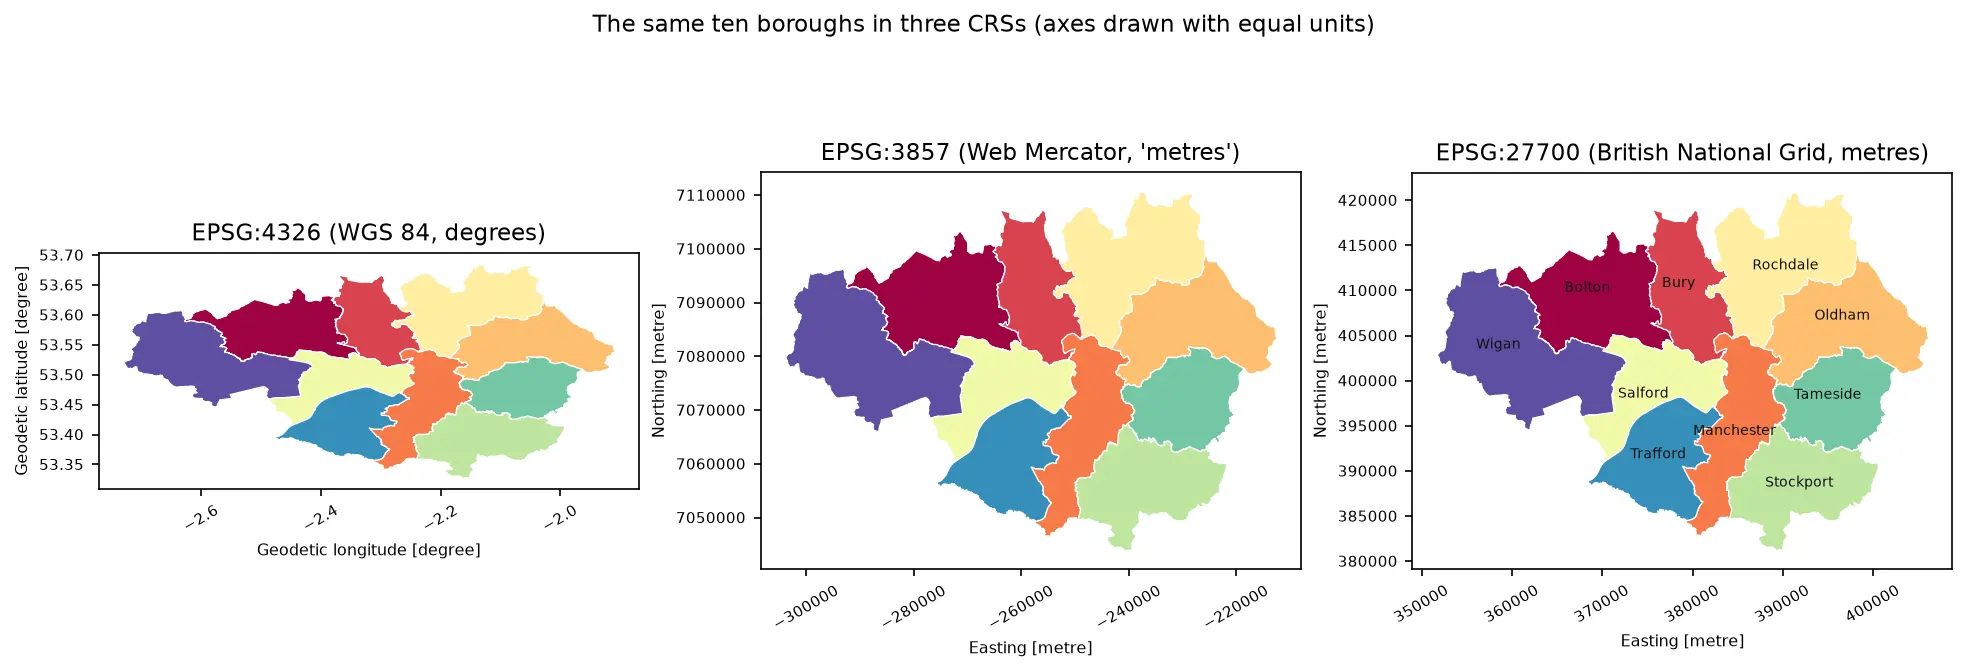
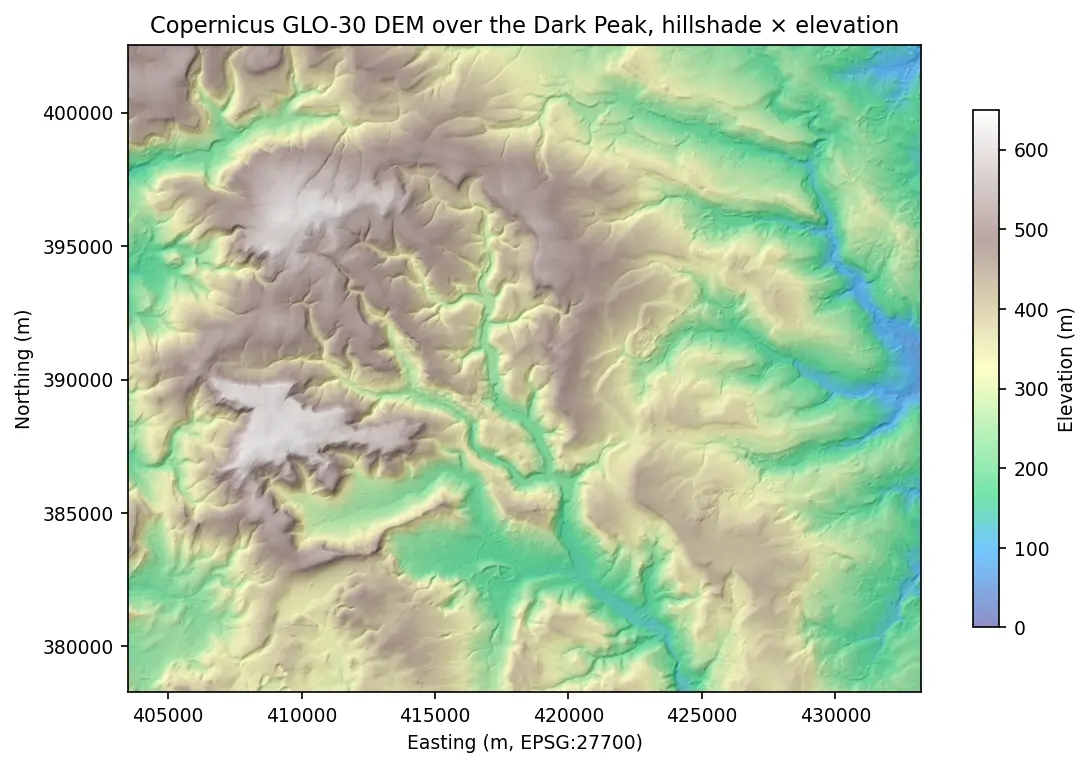
Coordinate reference systems in Python: EPSG codes, pyproj transforms and reprojecting vectors and rasters

A practical guide to coordinate reference systems in Python with pyproj, GeoPandas and rasterio, tested on real Greater Manchester data. Covers EPSG codes, WGS 84 vs British National Grid (EPSG:27700), the always_xy axis-order trap, OSTN15 vs Helmert datum shifts checked against 13,187 NaPTAN bus stops, measured area and distance errors in the wrong CRS, and reprojecting a GeoDataFrame and a Copernicus DEM raster.

Beginner 13 min read

Tutorial Python

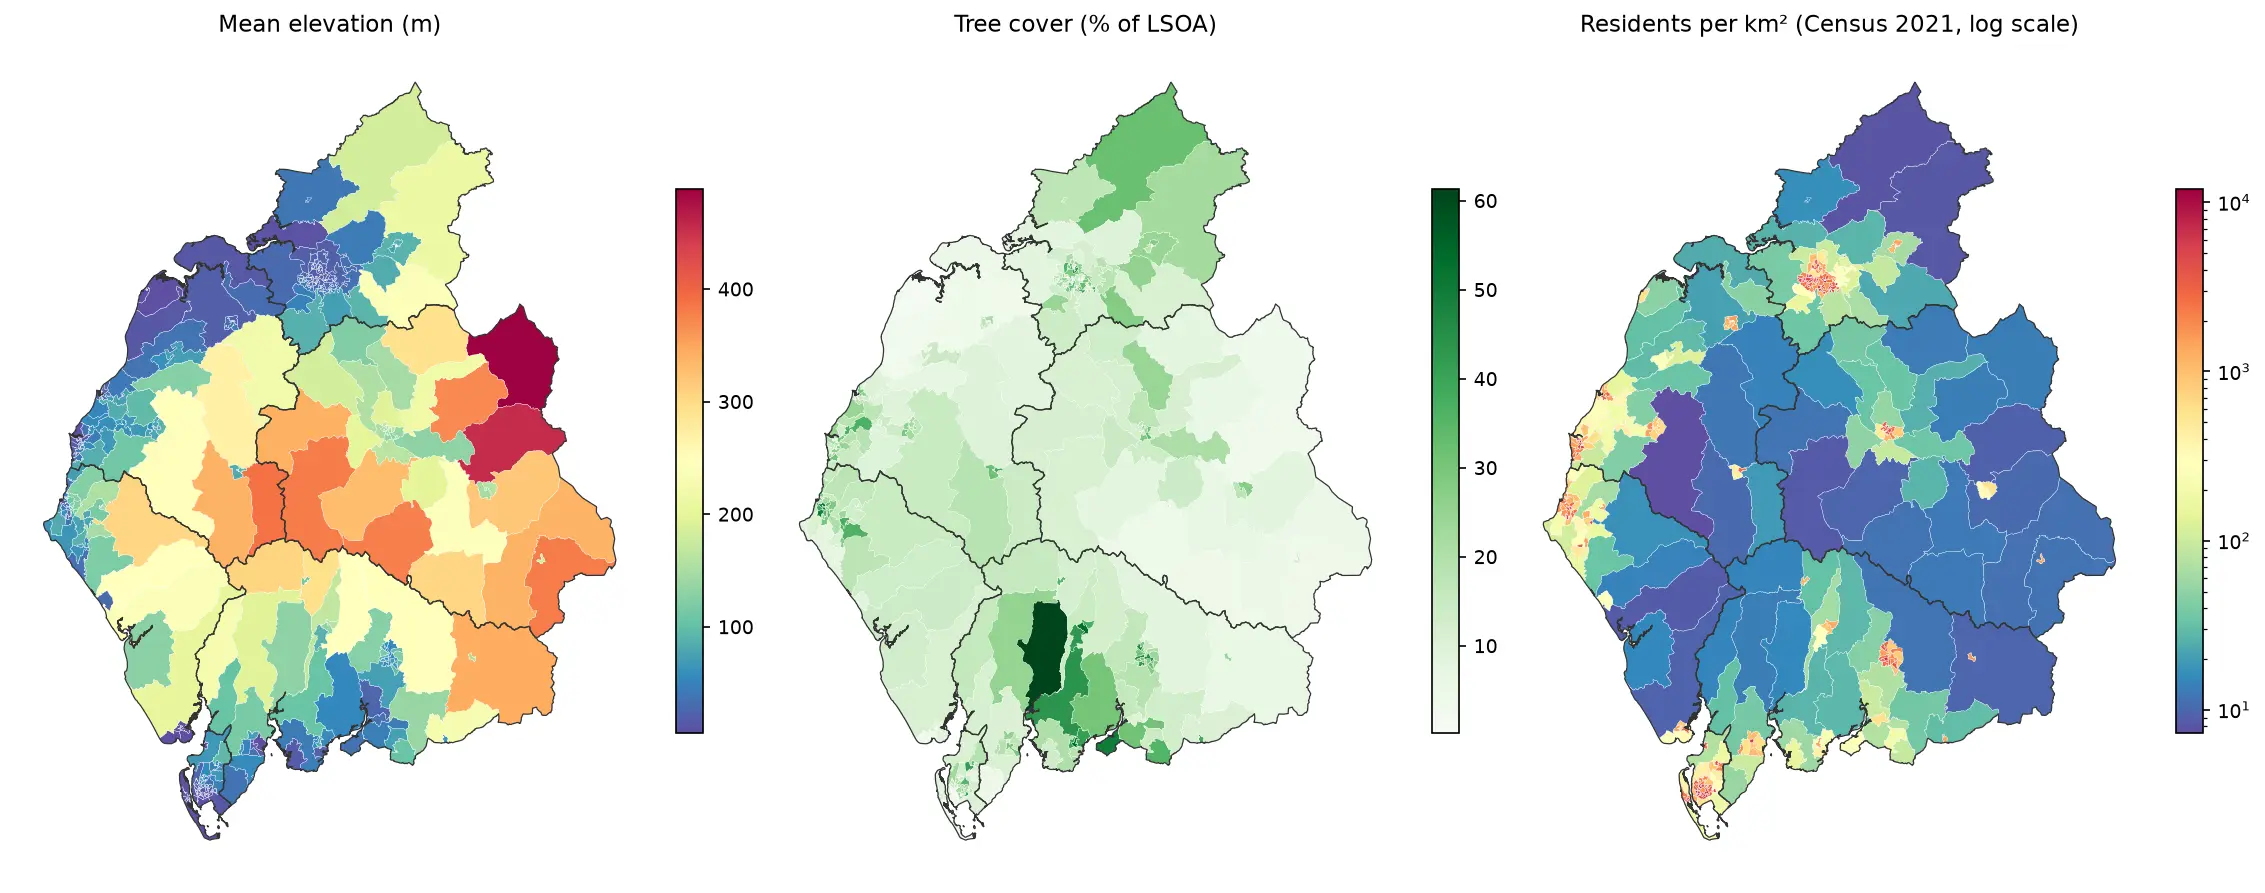
Zonal statistics in Python: exactextract vs rasterstats, with partial pixels, land-cover fractions and a benchmark

Calculate zonal statistics in Python with exactextract and rasterstats on real data: ONS 2021 LSOA boundaries for Cumbria with GHSL population, the Copernicus DEM and ESA WorldCover. Covers partial-pixel weighting vs pixel centroids, CRS alignment, categorical land-cover fractions, a speed benchmark, GeoPackage export and choropleth maps.

Intermediate 14 min read

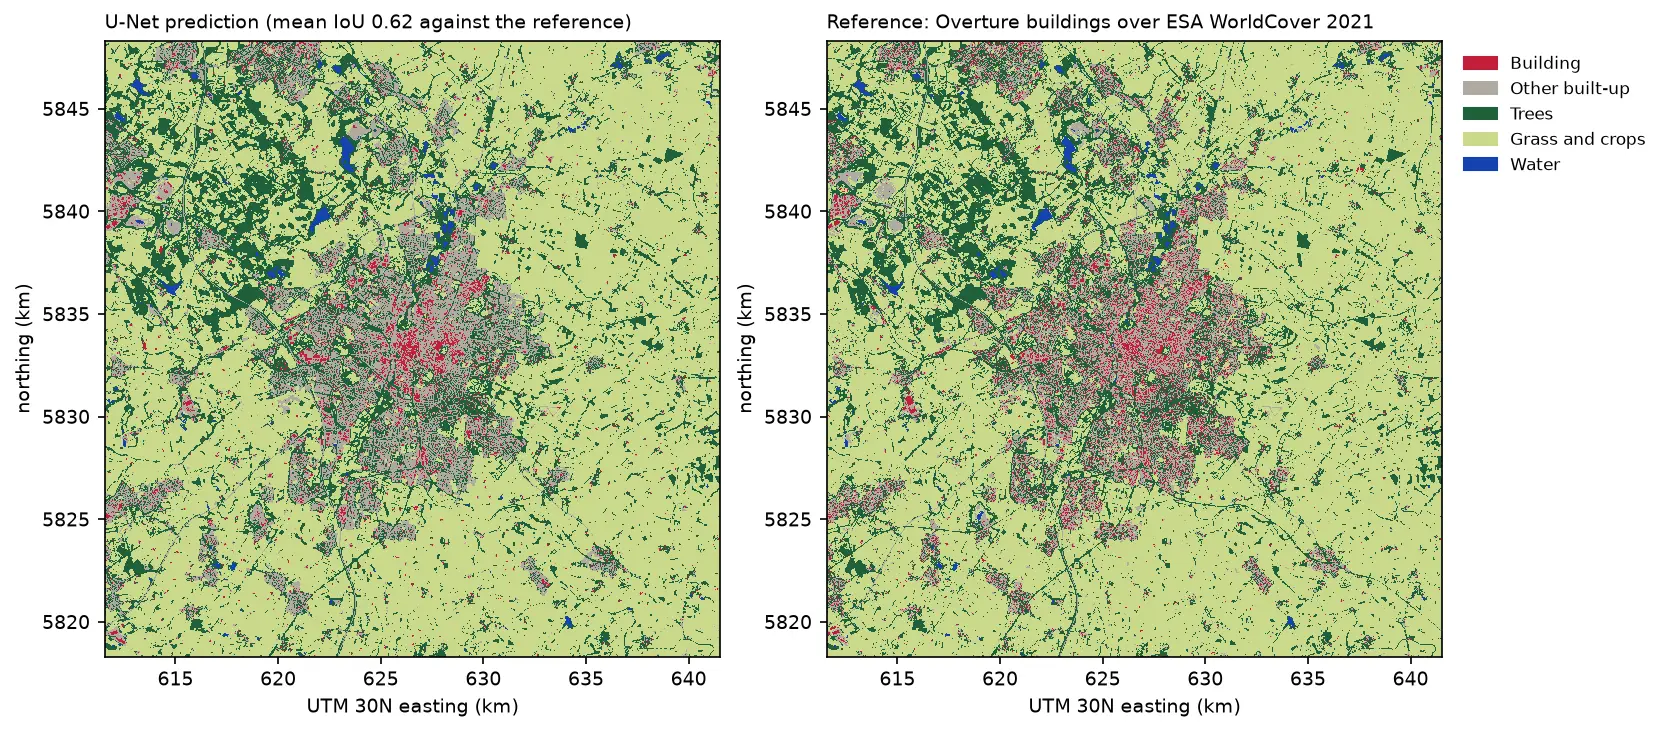
Two land cover maps of a 30 km square around Leicester side by side: the U-Net prediction on the left and the reference labels on the right. Both show the city in grey and red in the centre, surrounded by farmland in pale green, woods in dark green and reservoirs in blue. The prediction's city is smoother, with fewer separate red buildings.

Tutorial Python Part 3 of 3

Deep learning inference on large rasters: sliding-window prediction, COGs and polygons in Python

Run a trained PyTorch U-Net over a whole Sentinel-2 scene of a city it has never seen: tiled sliding-window inference on a large GeoTIFF with overlapping, blended windows, a georeferenced Cloud Optimised GeoTIFF of classes and confidence, raster-to-vector polygons with rasterio.features.shapes in a GeoPackage, and an honest check against reference labels.

Advanced 13 min read