#STAC

19 posts

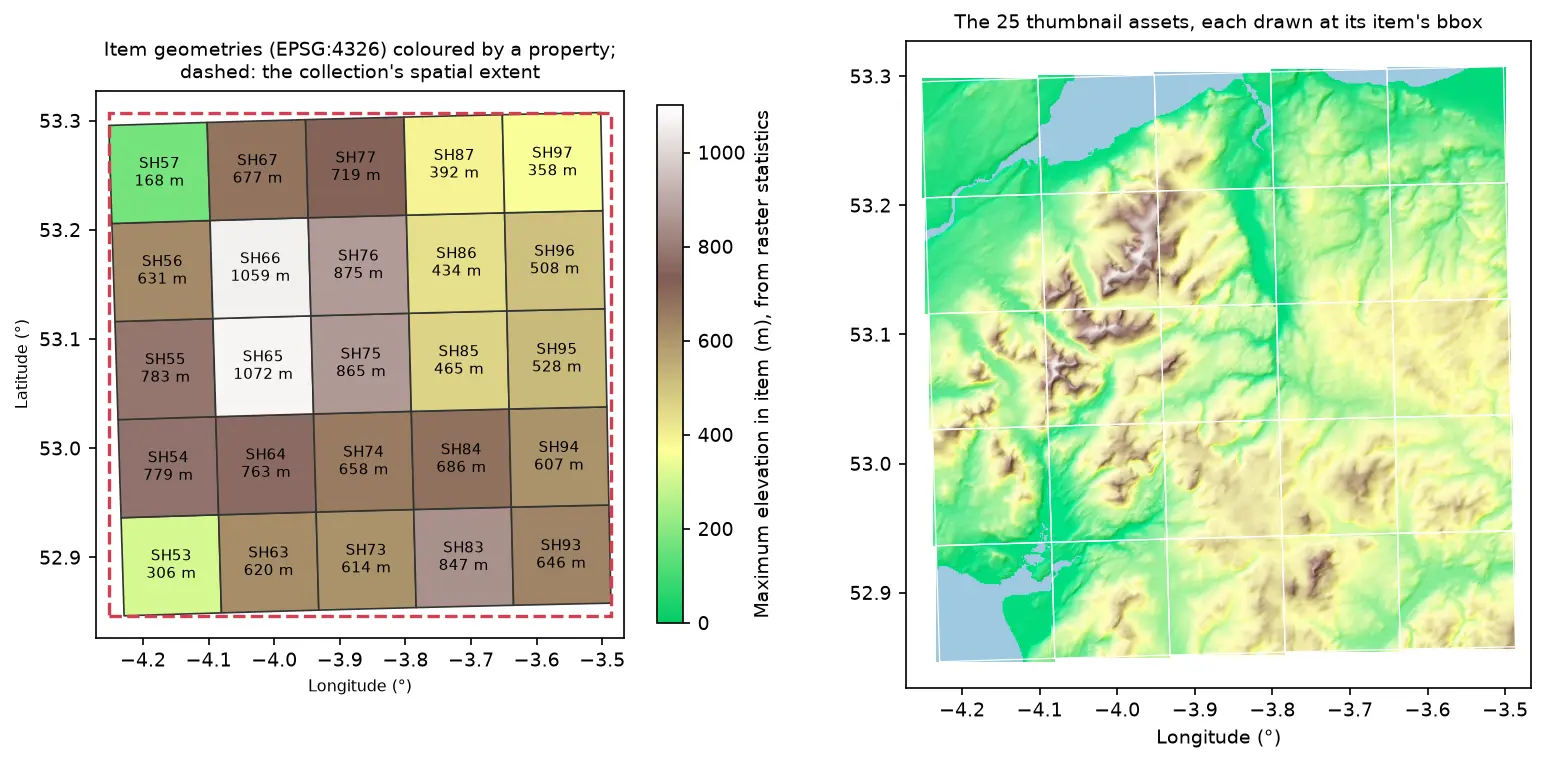
Two maps of Eryri in longitude and latitude. Left: 25 slightly rotated STAC item footprints labelled SH53 to SH97 and coloured by maximum elevation, inside a dashed red collection extent. Right: the 25 hillshaded thumbnail assets drawn at their item bounding boxes, forming one relief map

Tutorial Python Part 2 of 2

Build a STAC catalogue in Python with pystac, rio-stac and pystac-client

Turn 25 Cloud Optimised GeoTIFFs of Eryri into a static STAC catalogue with pystac and rio-stac, validate it against the JSON schemas, query it, serve it as static files, and compare it with the Earth Search and Planetary Computer STAC APIs through pystac-client.
Intermediate 12 min read

Tutorial Python

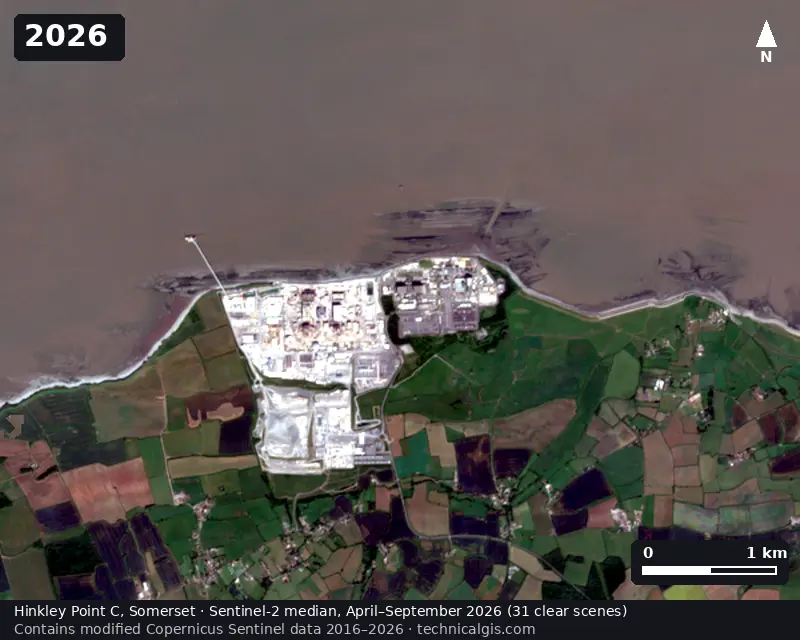
Satellite timelapse in Python: a Sentinel-2 GIF, WebP and MP4 of Hinkley Point C

Create a satellite timelapse in Python from free Sentinel-2 imagery. Select clear scenes with STAC, mask cloud, build one median composite per summer, apply a consistent stretch, add date labels and a scale bar, and export an animated GIF, WebP and MP4 of eleven years of construction at Hinkley Point C.

Intermediate 13 min read

Tutorial Python

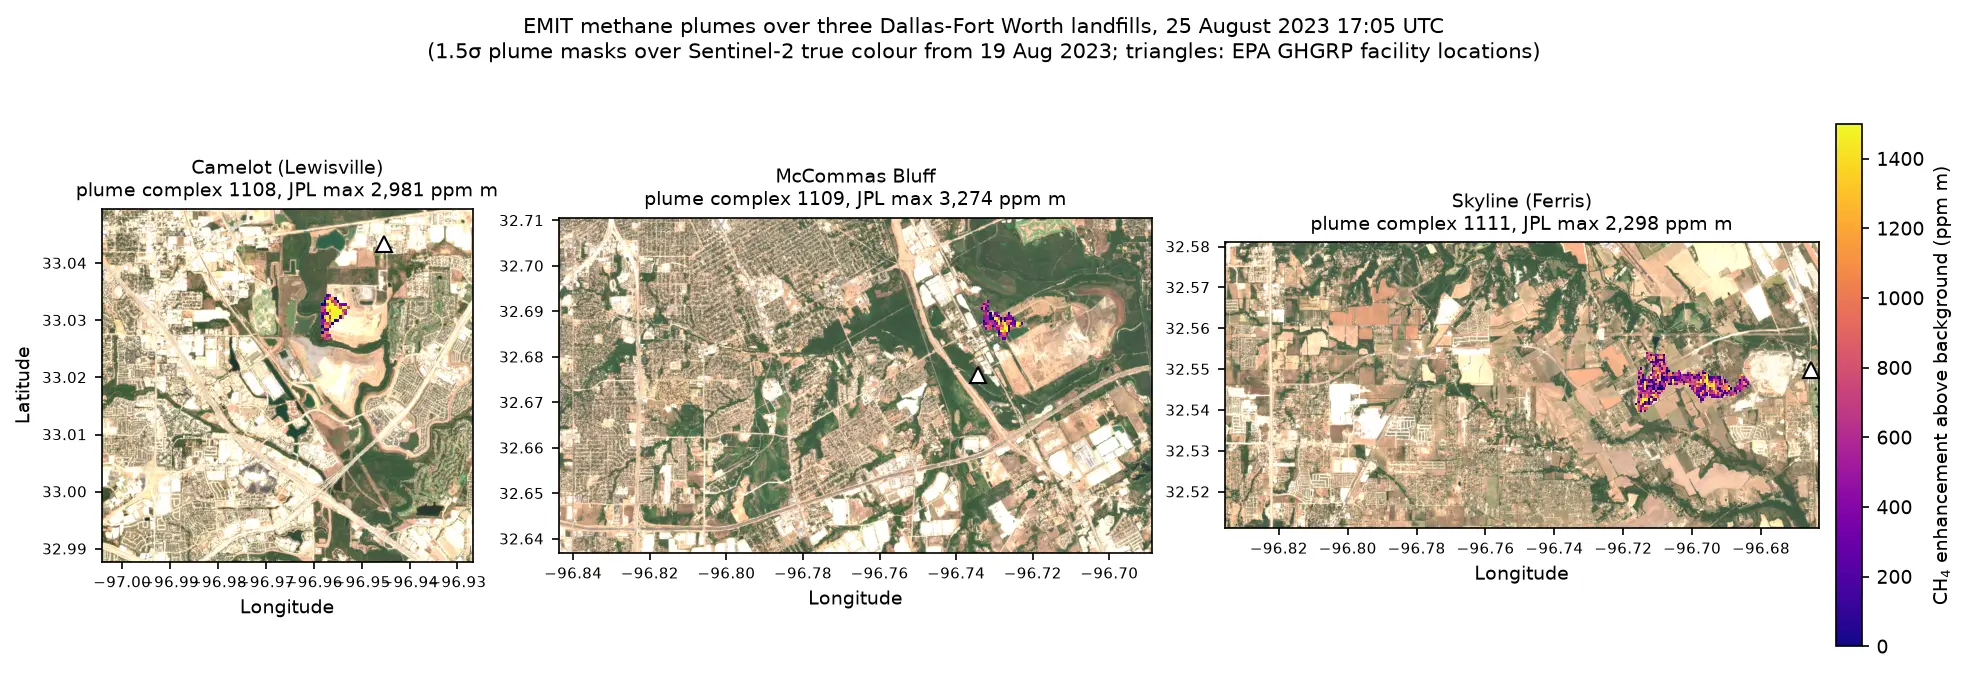
Methane plume detection in Python with NASA EMIT: mapping and quantifying landfill plumes

Detect and quantify methane plumes in Python with NASA's EMIT imaging spectrometer: load open EMIT methane enhancement data from NASA VEDA without a login, separate three Dallas-Fort Worth landfill plumes from the noise, compute the integrated mass enhancement, estimate emission rates with ERA5 winds, and compare them with EPA greenhouse gas inventory figures.

Advanced 17 min read

Tutorial Python

Sentinel-1 soil moisture in Python: change detection checked against COSMOS-UK

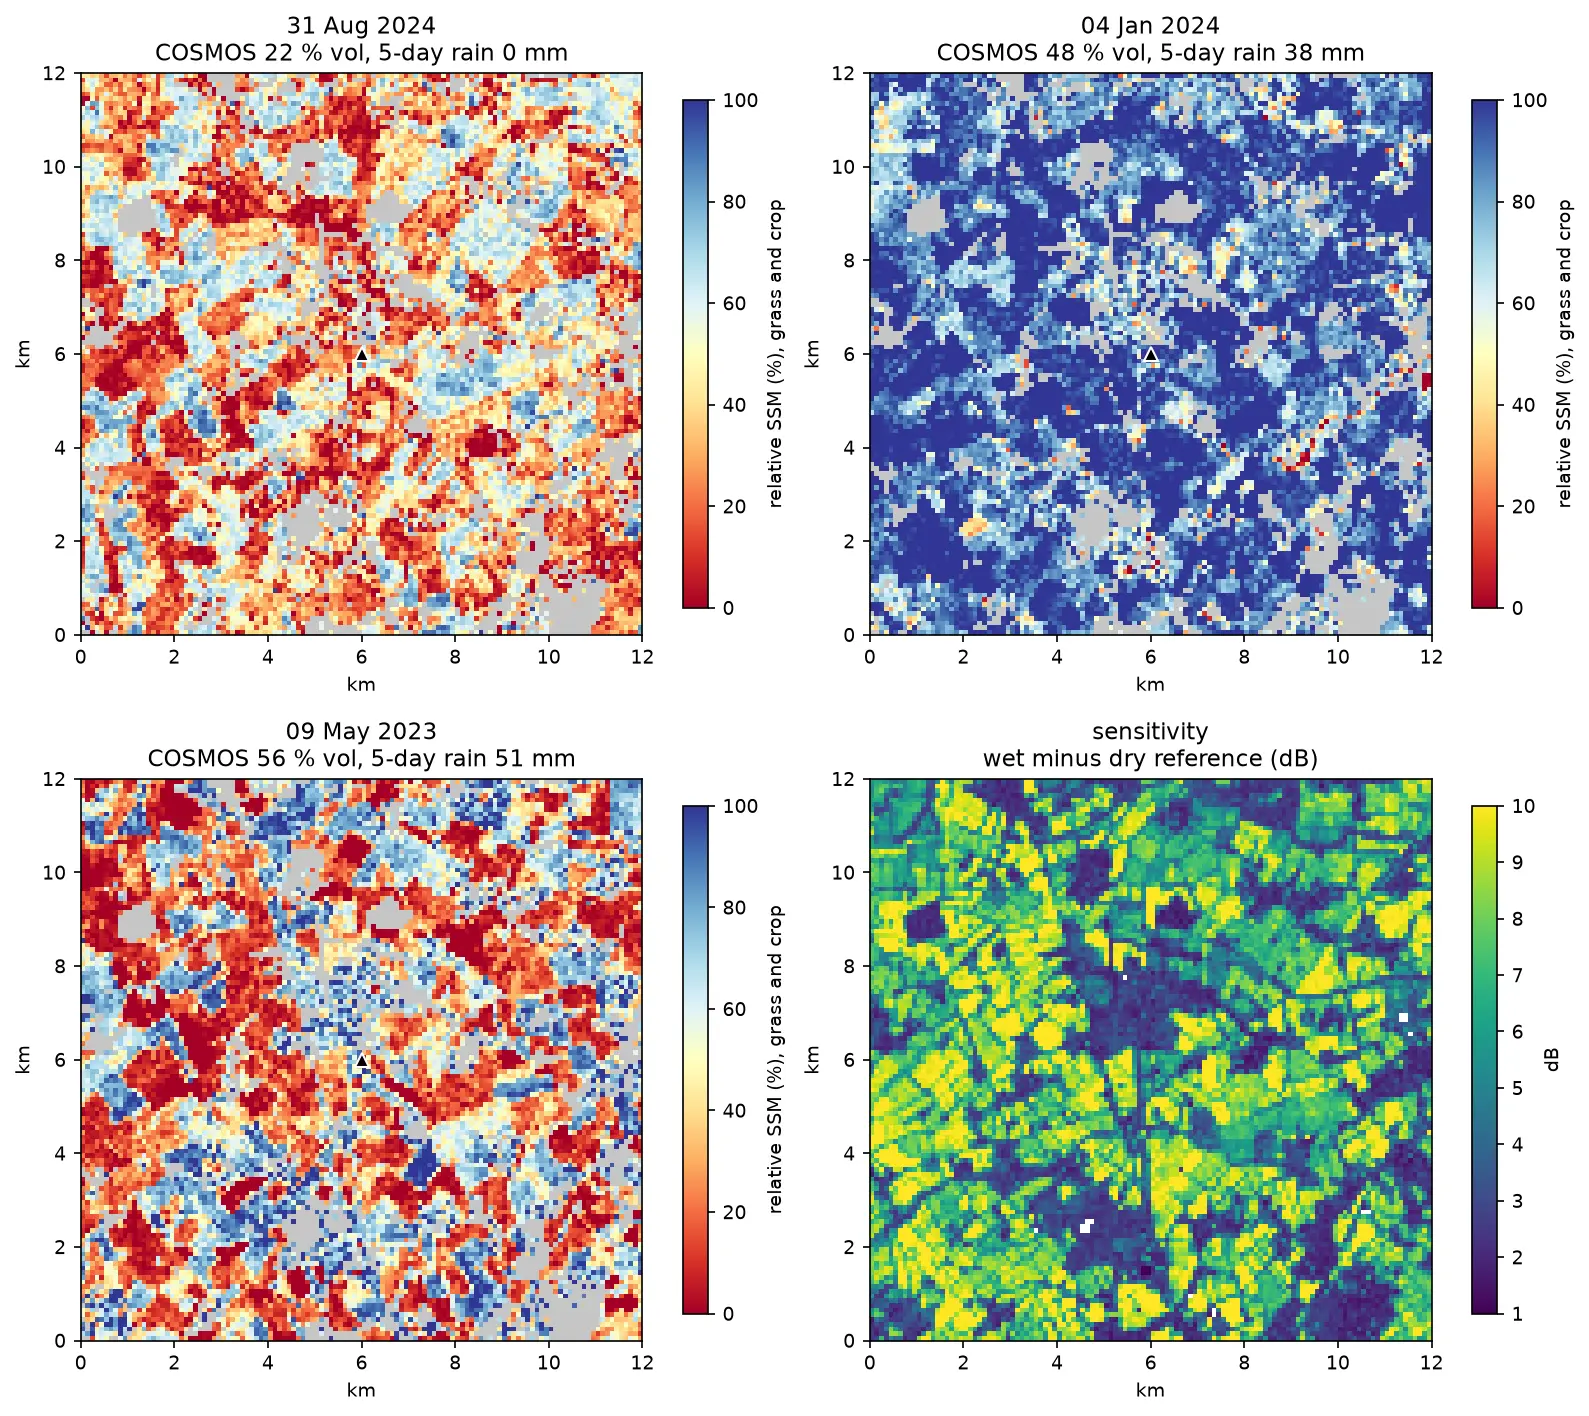
Estimate surface soil moisture from free Sentinel-1 radar in Python with the TU Wien change-detection method. Build dry and wet references per orbit, map relative soil moisture at 100 m, and test it honestly against four COSMOS-UK stations and their rain gauges.

Intermediate 13 min read

Tutorial Python

Sentinel-2 cloud and cloud-shadow masking in Python: SCL vs s2cloudless vs OmniCloudMask

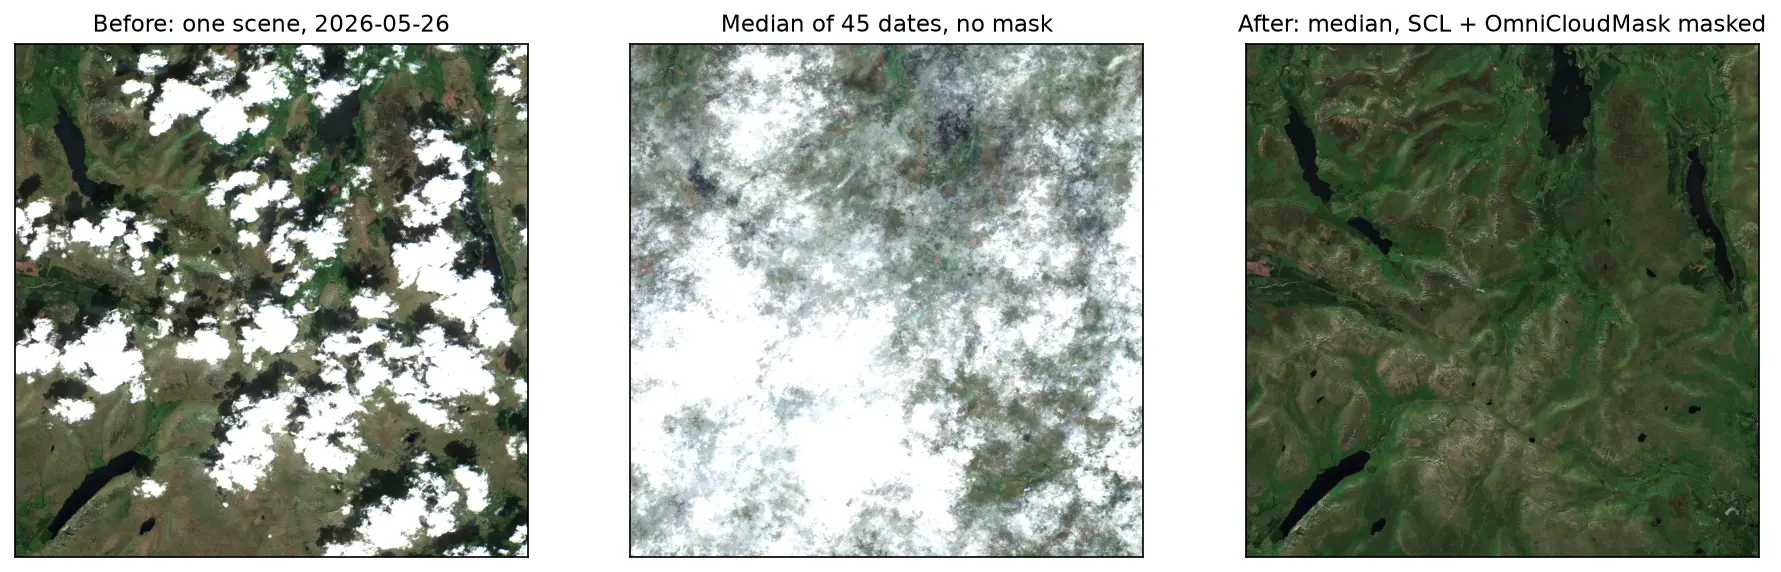
Mask clouds and cloud shadows in Sentinel-2 L2A imagery with Python. Compare the Scene Classification Layer (SCL), s2cloudless, OmniCloudMask and a simple threshold over the Lake District, measure how far they agree, score them against 186 reference points and build a cloud-free median composite.

Intermediate 15 min read

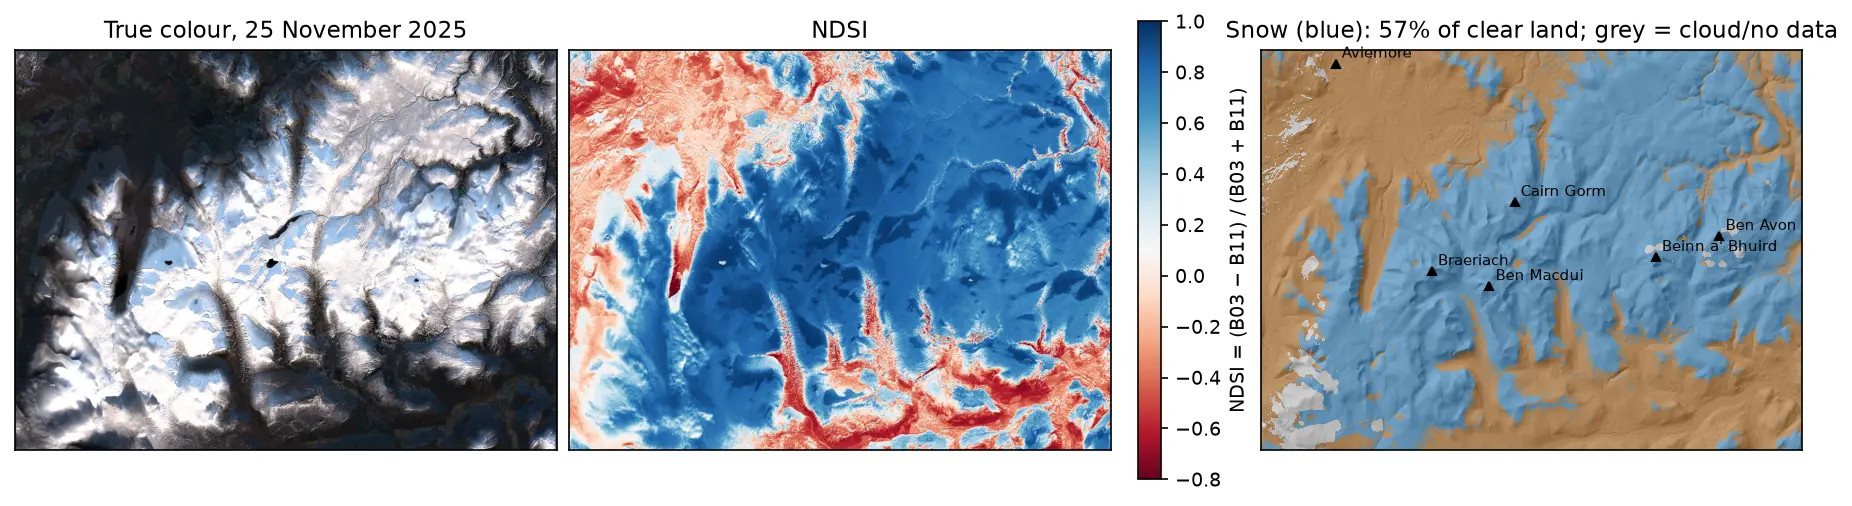
Three panels of the Cairngorms on 25 November 2025: a true-colour Sentinel-2 image with snow on the plateaux and long shadows in the glens; the NDSI, blue over snow and red over forest and bare ground; and a snow map over hillshade, with snow in blue on the high ground around Cairn Gorm, Ben Macdui, Braeriach, Beinn a' Bhuird and Ben Avon, covering 57% of the clear land.

Tutorial Python

Snow cover mapping with NDSI in Python: Sentinel-2 and MODIS over the Cairngorms

Map snow cover in Python with the Normalised Difference Snow Index (NDSI) from Sentinel-2 and the daily MODIS snow product on the Microsoft Planetary Computer: choosing the NDSI threshold, separating snow from cloud, snow-covered area through the winter of 2025–26 in the Cairngorms, and the snowline by elevation and aspect with the Copernicus DEM.

Intermediate 15 min read

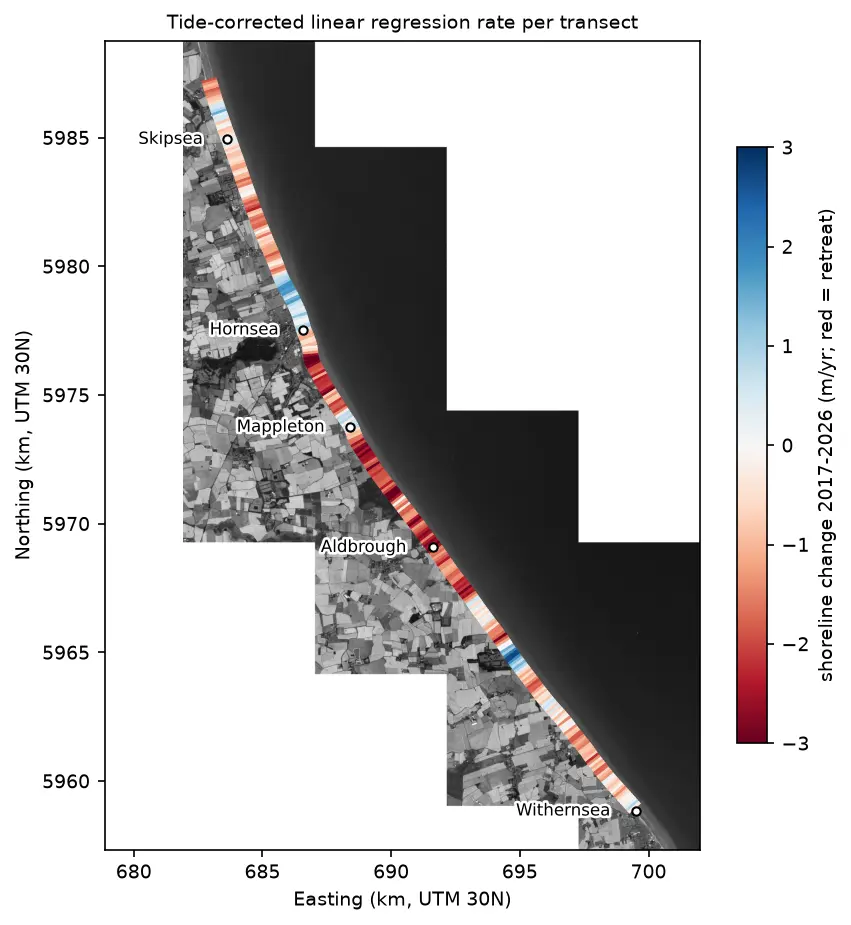
Map of the Holderness coast from Skipsea to Withernsea in greyscale Sentinel-2, with each 100 m transect coloured by its shoreline change rate from 2017 to 2026: mostly red (retreat), with blue (advance) patches north of Hornsea, at Mappleton and near Grimston.

Tutorial Python

Coastal erosion and shoreline change from Sentinel-2 in Python (Holderness, 2017–2026)

Measure shoreline change on one of Europe's fastest-eroding coasts with free Sentinel-2 imagery and Python: MNDWI and Otsu thresholding, sub-pixel shorelines with find_contours, shore-normal transects, a tide correction from open tide-gauge data, end-point and linear regression rates, and an honest comparison with East Riding of Yorkshire Council's cliff monitoring.

Advanced 21 min read

Tutorial Python Part 1 of 2

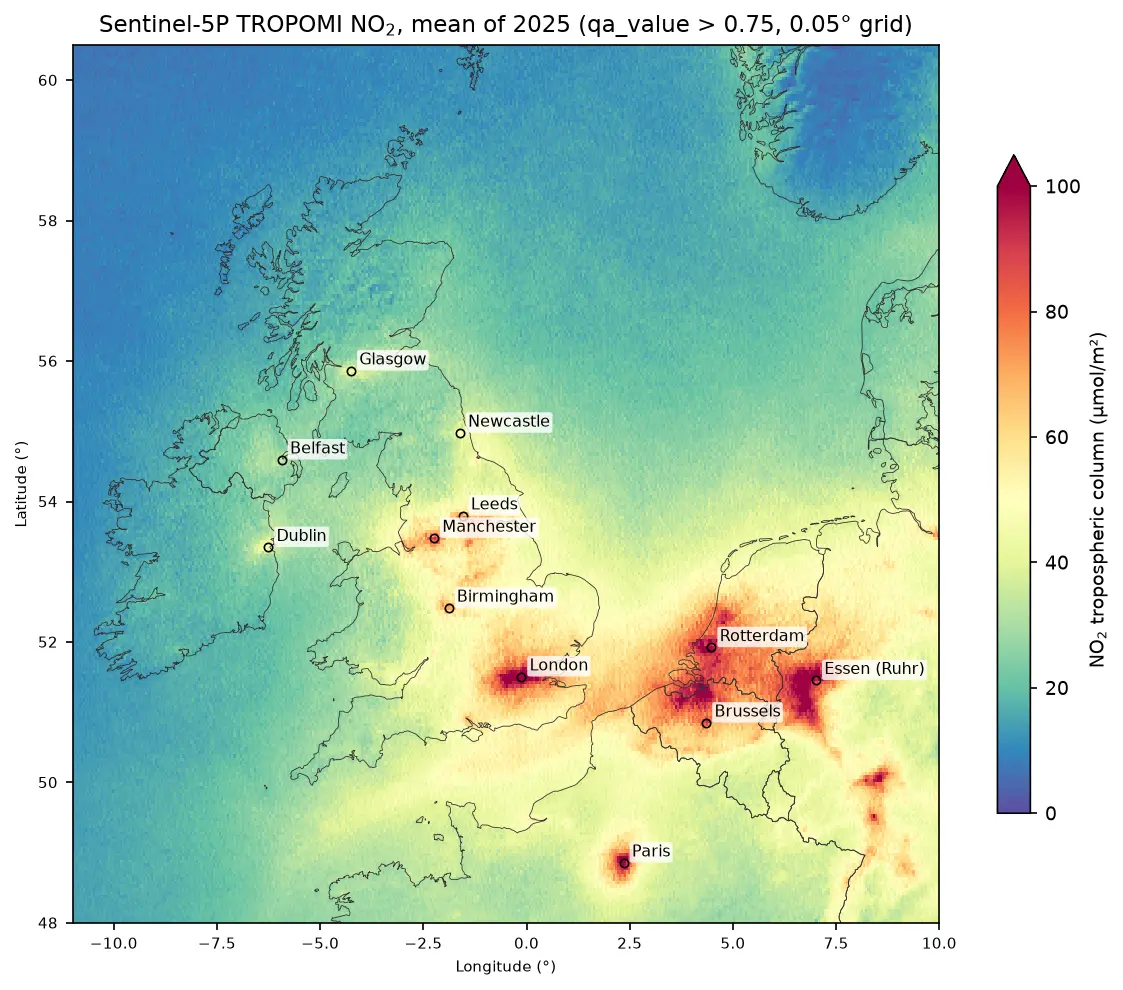
Sentinel-5P NO₂ in Python: mapping air pollution from TROPOMI over the UK and north-west Europe

Map nitrogen dioxide air pollution from Sentinel-5P TROPOMI Level-2 data in Python: stream a full year of orbits from the Planetary Computer, apply the qa_value > 0.75 filter, grid swaths to a regular raster, build monthly and seasonal composites, rank cities and measure the weekend drop, with an honest explanation of what a tropospheric column is.

Intermediate 17 min read

Tutorial Python

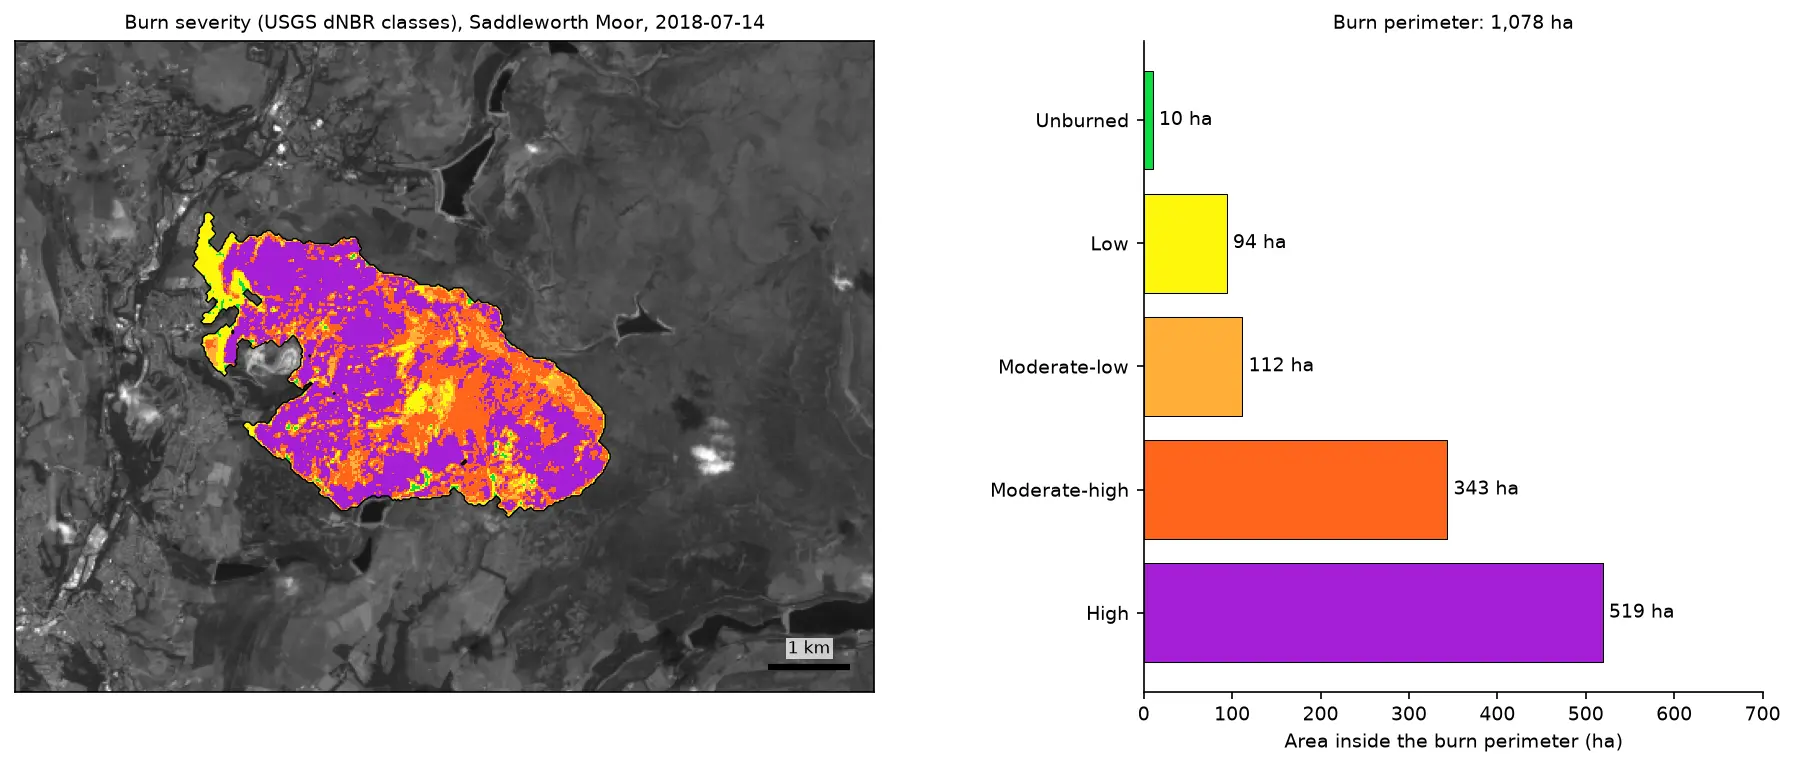
Burn severity mapping with Sentinel-2 and dNBR in Python (Saddleworth Moor 2018)

Map wildfire burn severity in Python with free Sentinel-2 imagery: NBR calculation, cloud and water masking with SCL, dNBR with an offset, USGS severity classes and burned hectares, a burn perimeter, fire progression, RdNBR and an eight-year recovery record for the 2018 Saddleworth Moor fire.

Intermediate 15 min read

Tutorial Python

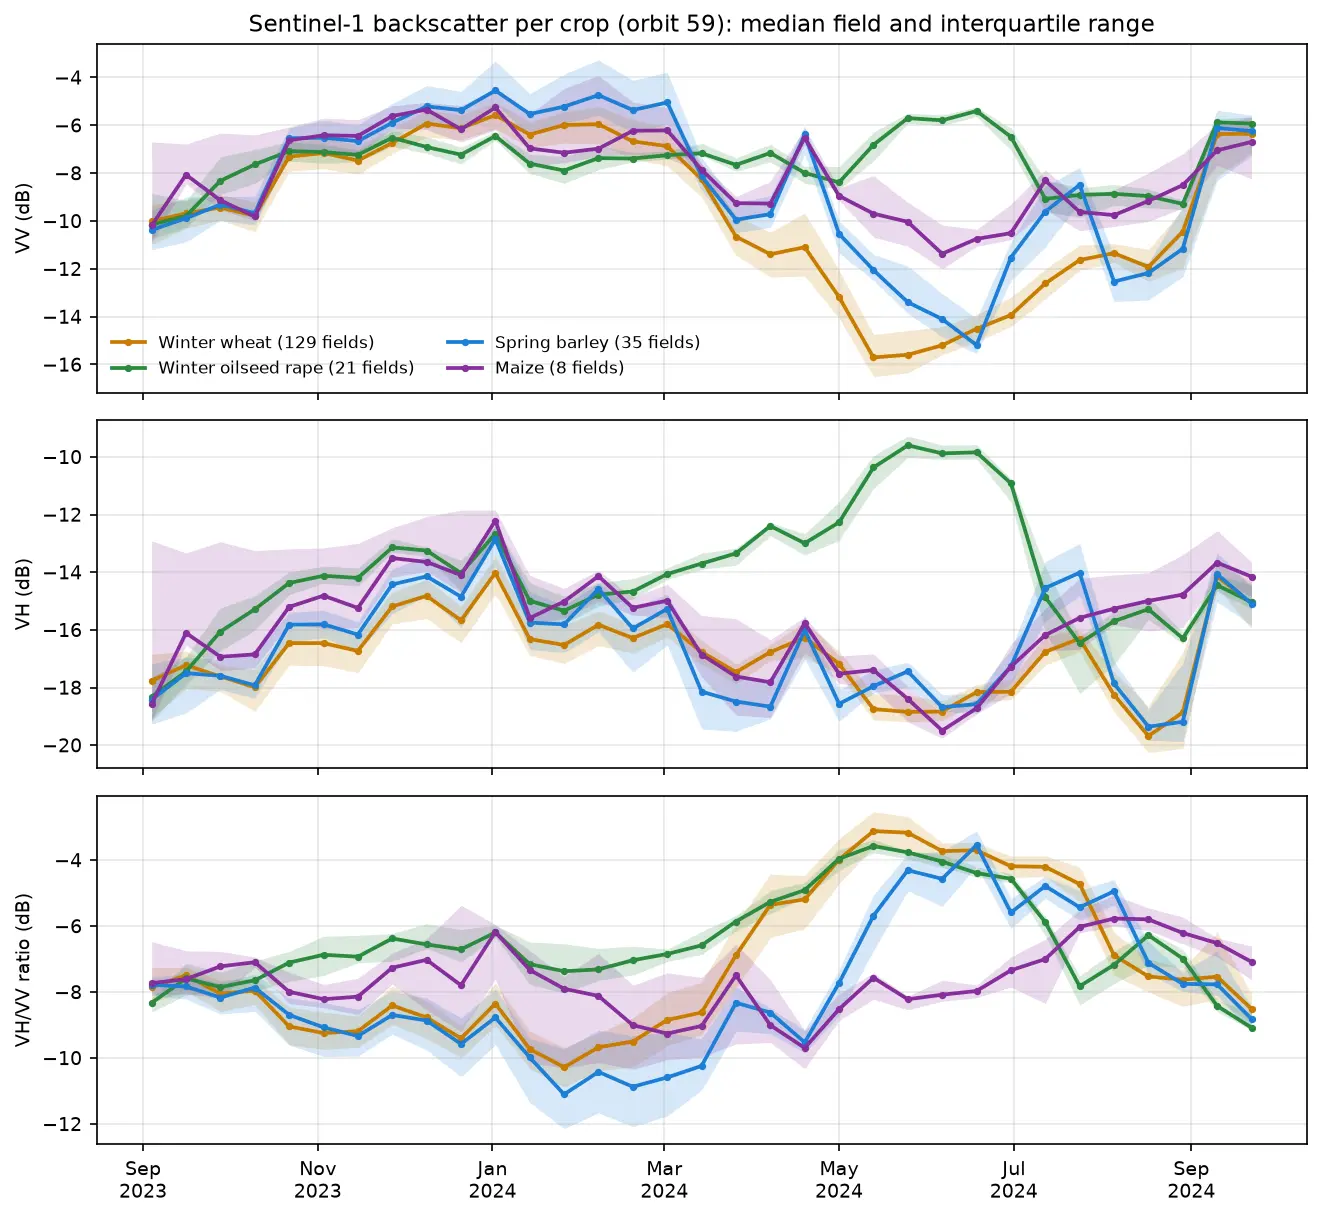
Sentinel-1 crop monitoring in Python: SAR time series for wheat and oilseed rape

Monitor crops through cloud with free Sentinel-1 radar. Build VV, VH and VH/VV ratio time series for 247 fields in Cambridgeshire, beat speckle by field-averaging, read the growth signatures of winter wheat and oilseed rape, and compare with the gaps that cloud leaves in Sentinel-2 NDVI.

Intermediate 16 min read

Tutorial Python

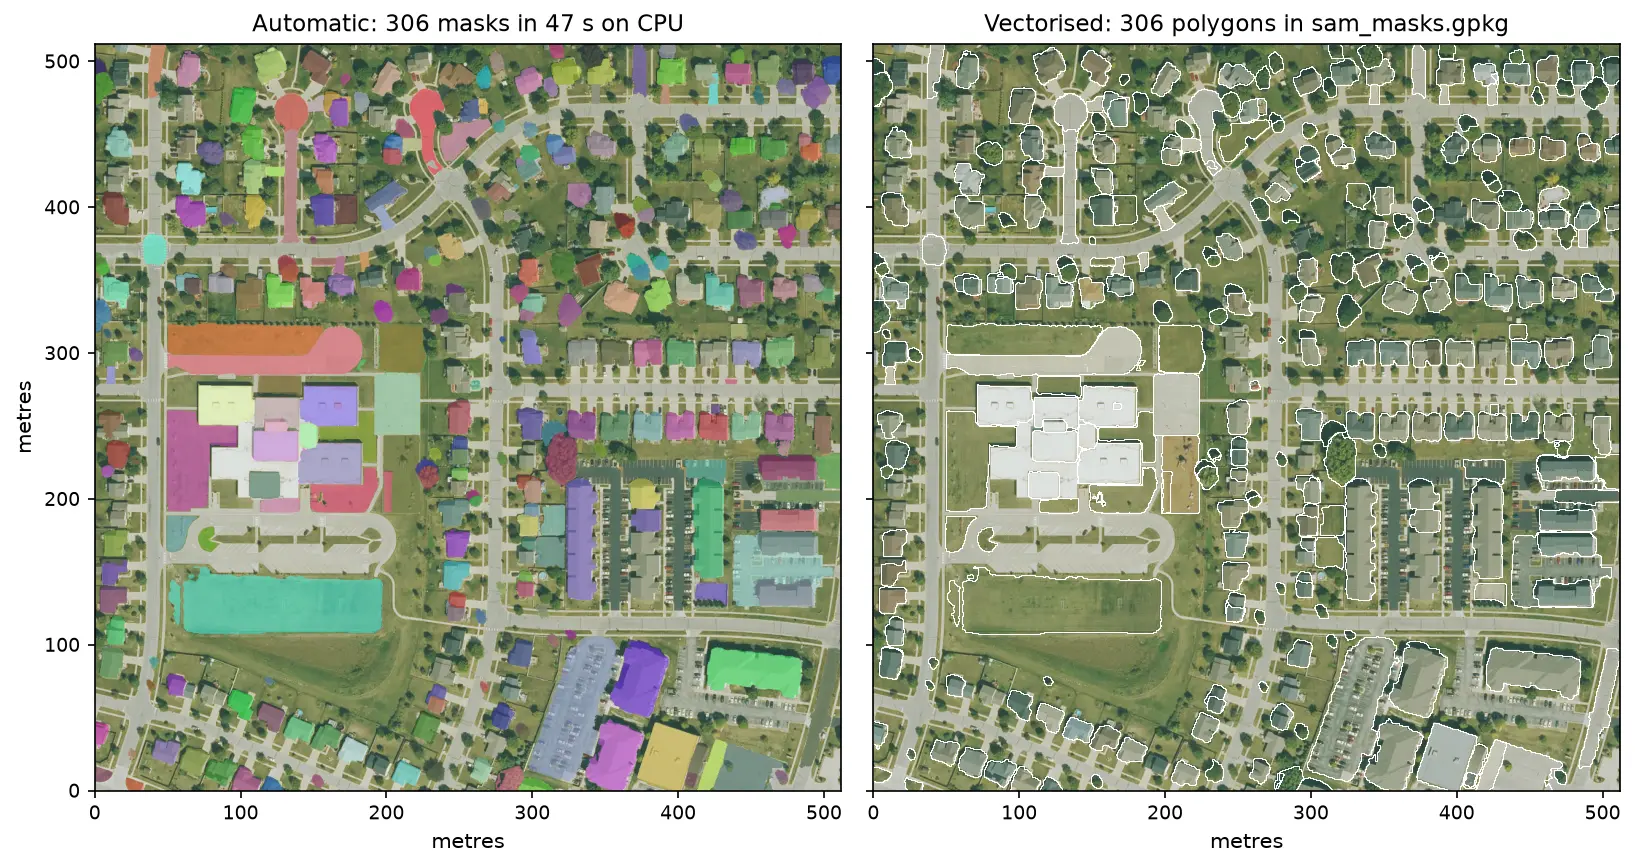
Segment Anything on satellite and aerial imagery in Python: a samgeo tutorial

Run Meta's Segment Anything Model on high-resolution aerial imagery with segment-geospatial (samgeo), on a CPU. Generate masks automatically, vectorise them to a GeoPackage, filter them by area, shape and NDVI to find buildings, and prompt SAM with points and boxes, checked against OpenStreetMap.

Intermediate 14 min read

Tutorial Python

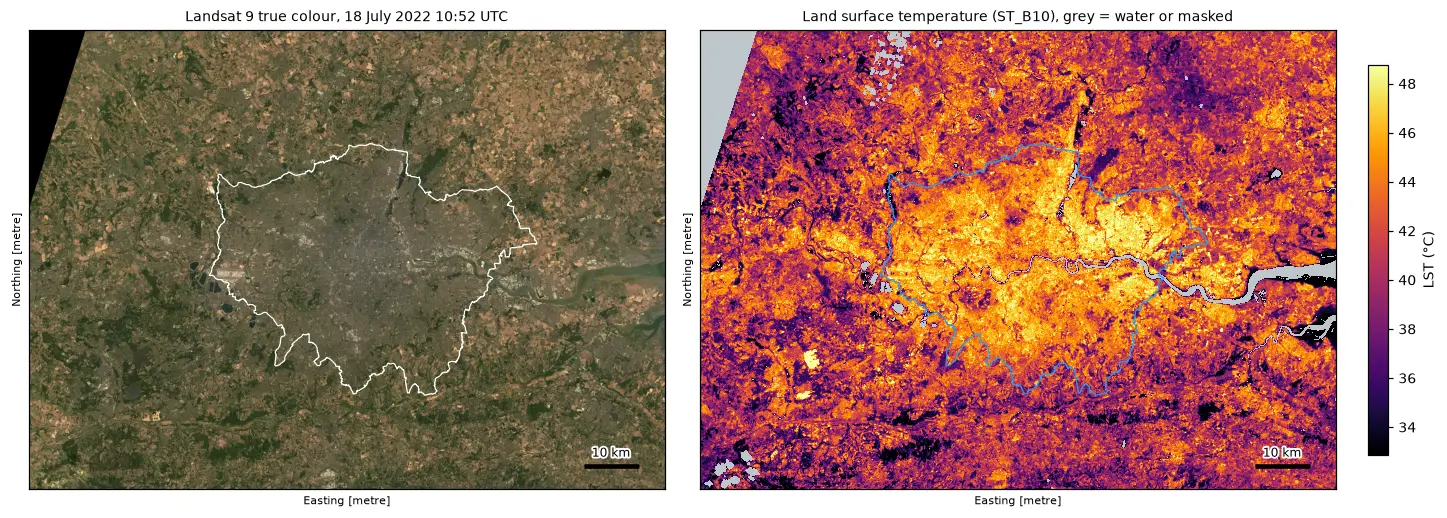
Land surface temperature from Landsat in Python: mapping London's urban heat island

Calculate land surface temperature from Landsat 8 and 9 Collection 2 Level-2 data in Python: ST_B10 scale and offset, QA_PIXEL cloud masking, LST by land cover and NDVI, an urban-rural transect, hotspots with OpenStreetMap and an honest comparison with air temperature, for London in the July 2022 heatwave.

Intermediate 17 min read

Tutorial Python

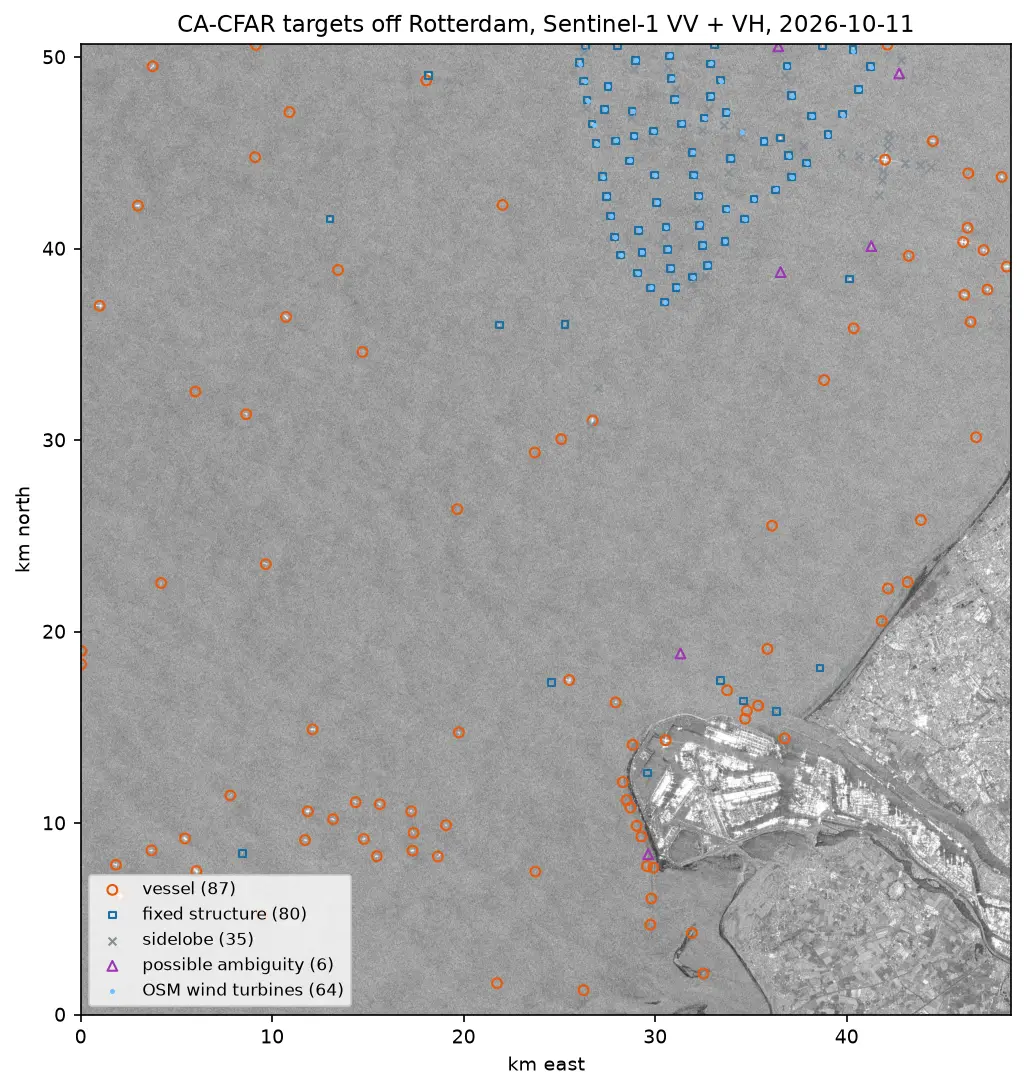
Sentinel-1 ship detection in Python: a CA-CFAR detector off the Port of Rotterdam

Detect ships in free Sentinel-1 SAR imagery with a cell-averaging CFAR detector written in NumPy and SciPy: mask the land, set a threshold from a speckle model, cluster detections into targets, reject wind turbines, sidelobes and ambiguities, compare VV with VH and export the vessels as GeoJSON.

Intermediate 16 min read

Tutorial Python

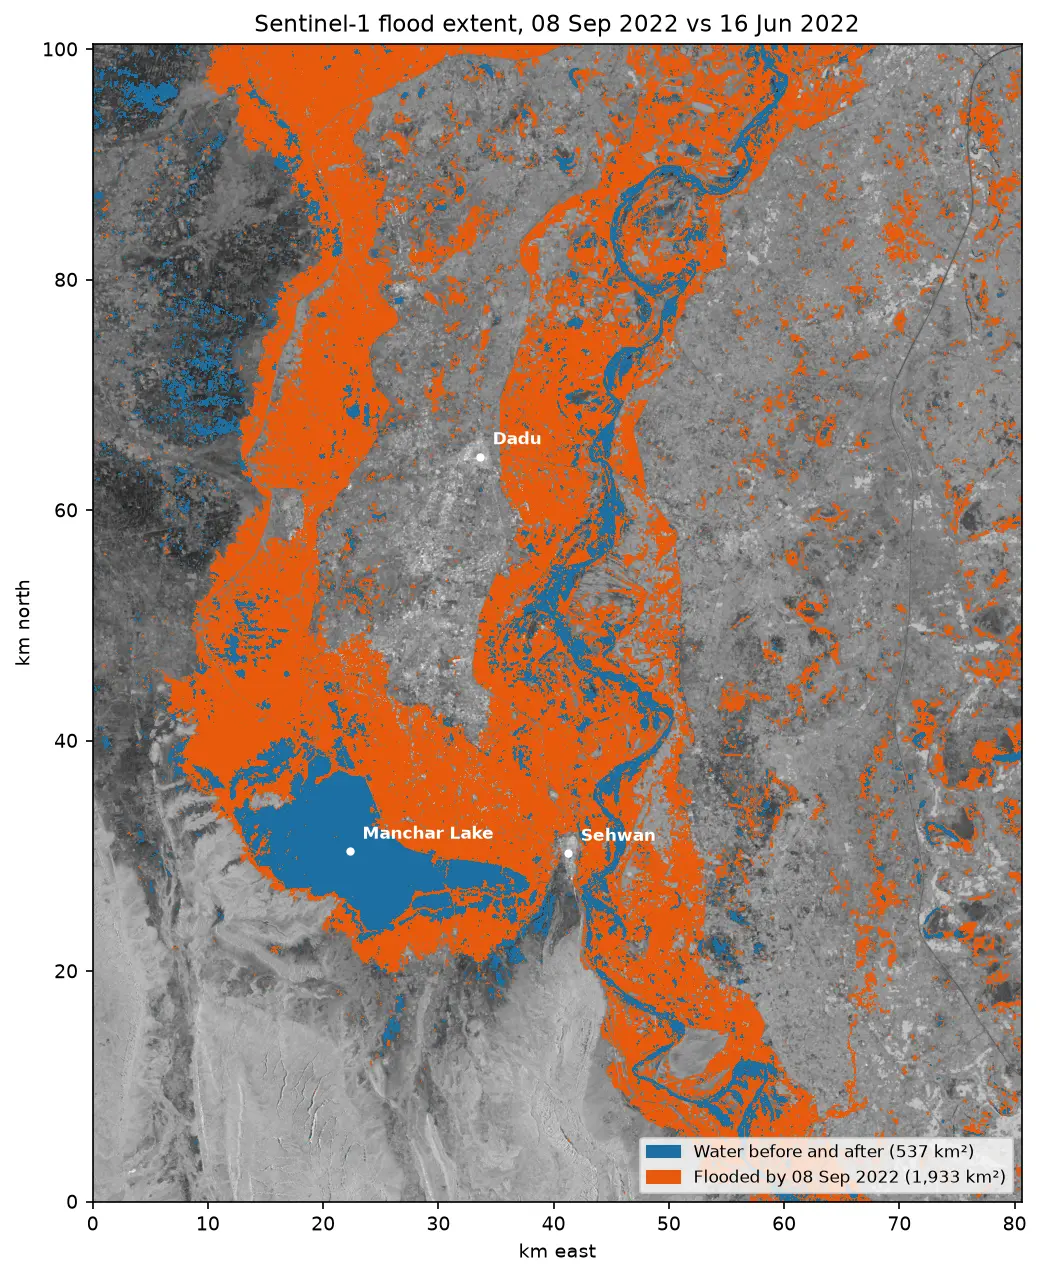
Sentinel-1 SAR flood mapping in Python: the 2022 Pakistan floods

Map the 2022 Sindh floods with free Sentinel-1 radar from the Microsoft Planetary Computer: convert backscatter to decibels, remove speckle with a Lee filter, pick a water threshold with Otsu's method, and measure the flood extent and how it receded over seven months.

Intermediate 10 min read