#Time series

3 posts

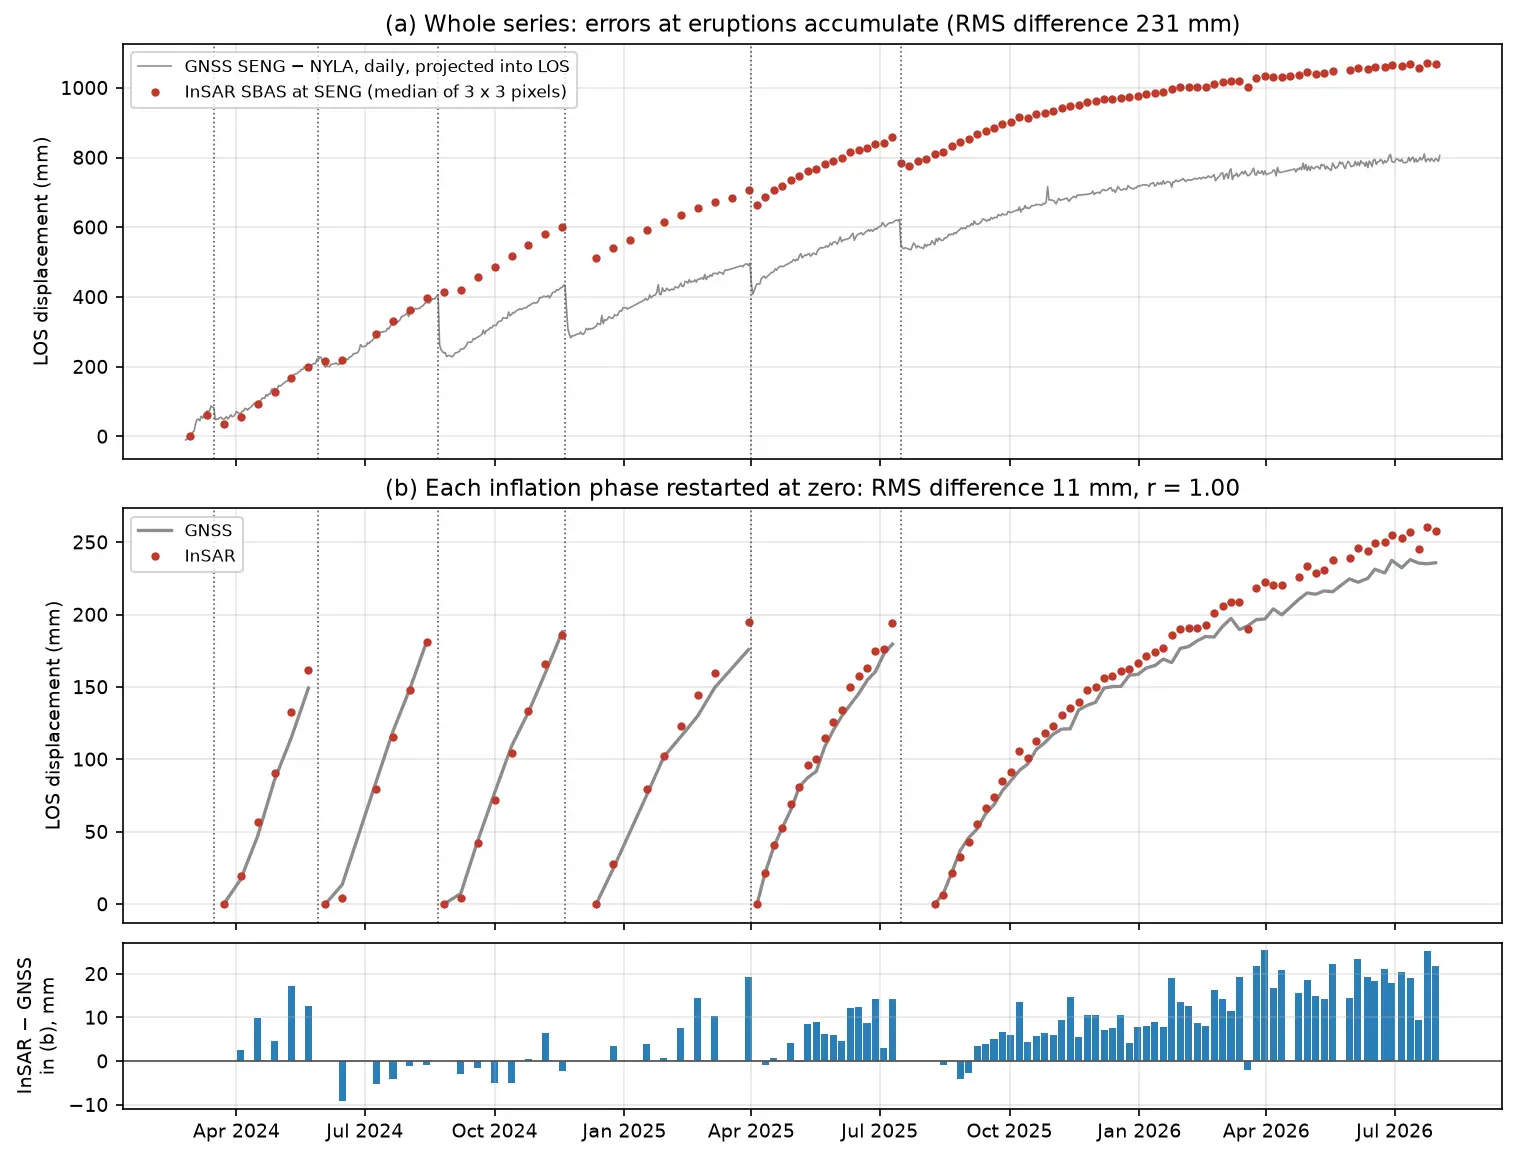
Time series of line-of-sight uplift at the SENG GNSS station at Svartsengi in Iceland from 2024 to 2026: red InSAR points and a grey GNSS line rise in a sawtooth of six inflation phases separated by eruptions, and agree closely once each phase is restarted at zero.

Tutorial Python Part 3 of 3

InSAR time series in Python: Svartsengi inflation cycles validated with GNSS

Build an SBAS InSAR time series in Python from 364 COMET LiCSAR Sentinel-1 interferograms of the Svartsengi volcano in Iceland. Check unwrapping with phase closure, invert pixel by pixel with weighted least squares, project GNSS east, north and up into the line of sight, and validate six inflation–eruption cycles against the SENG station.
Advanced 21 min read

Tutorial Python

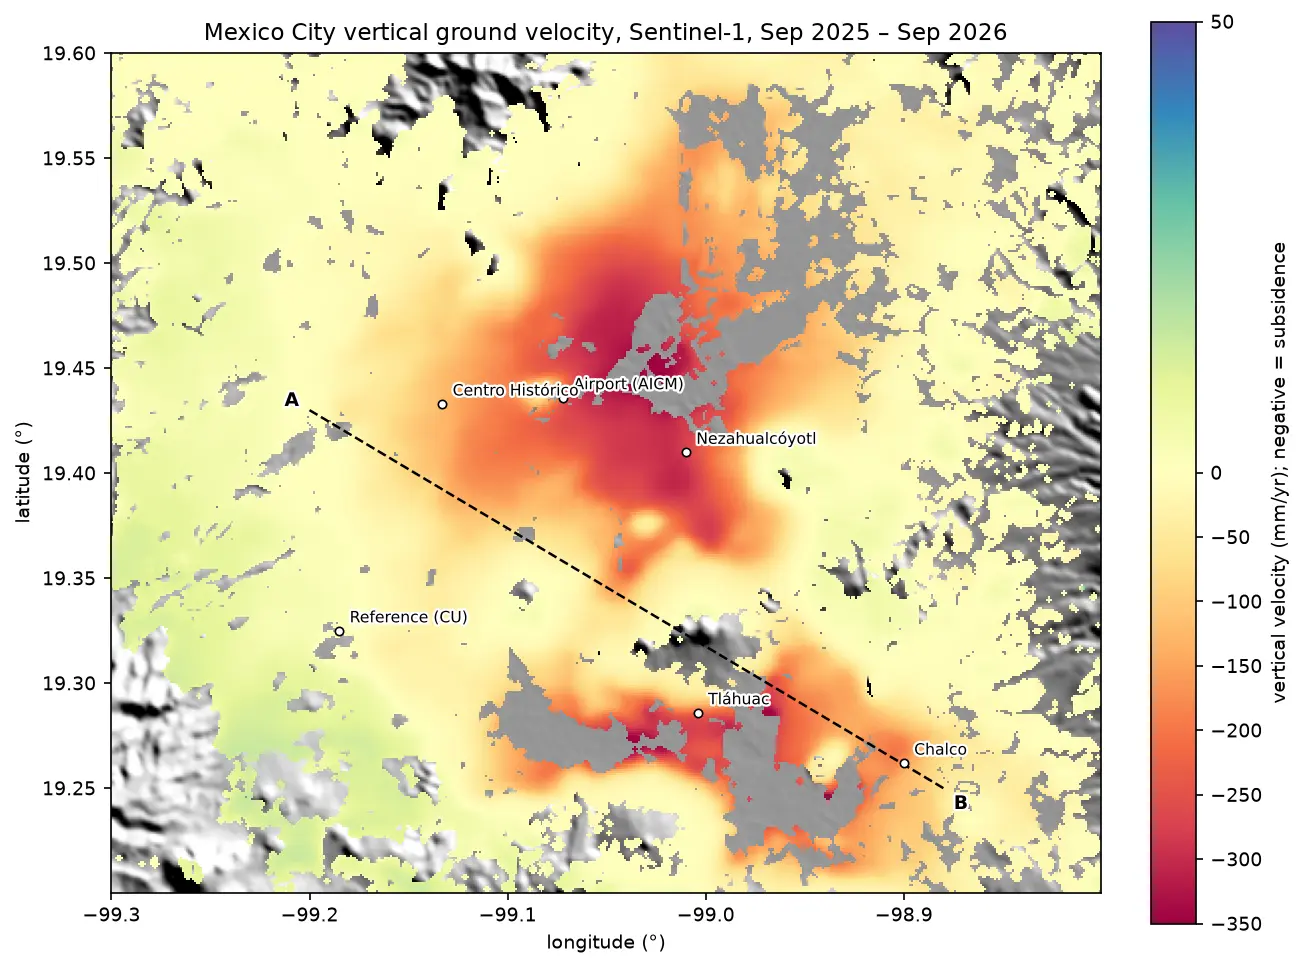
InSAR ground subsidence in Python: one year of Mexico City sinking, from Sentinel-1

Map ground subsidence with Sentinel-1 InSAR in Python: stream 170 real interferograms of Mexico City, convert unwrapped phase to millimetres of line-of-sight motion, mask low coherence, invert a small-baseline network into a time series, and cross-check the velocity with MintPy.

Advanced 17 min read