#xarray

6 posts

Tutorial Python

Parallel raster processing in Python with dask and rioxarray: a whole Sentinel-2 tile without running out of memory

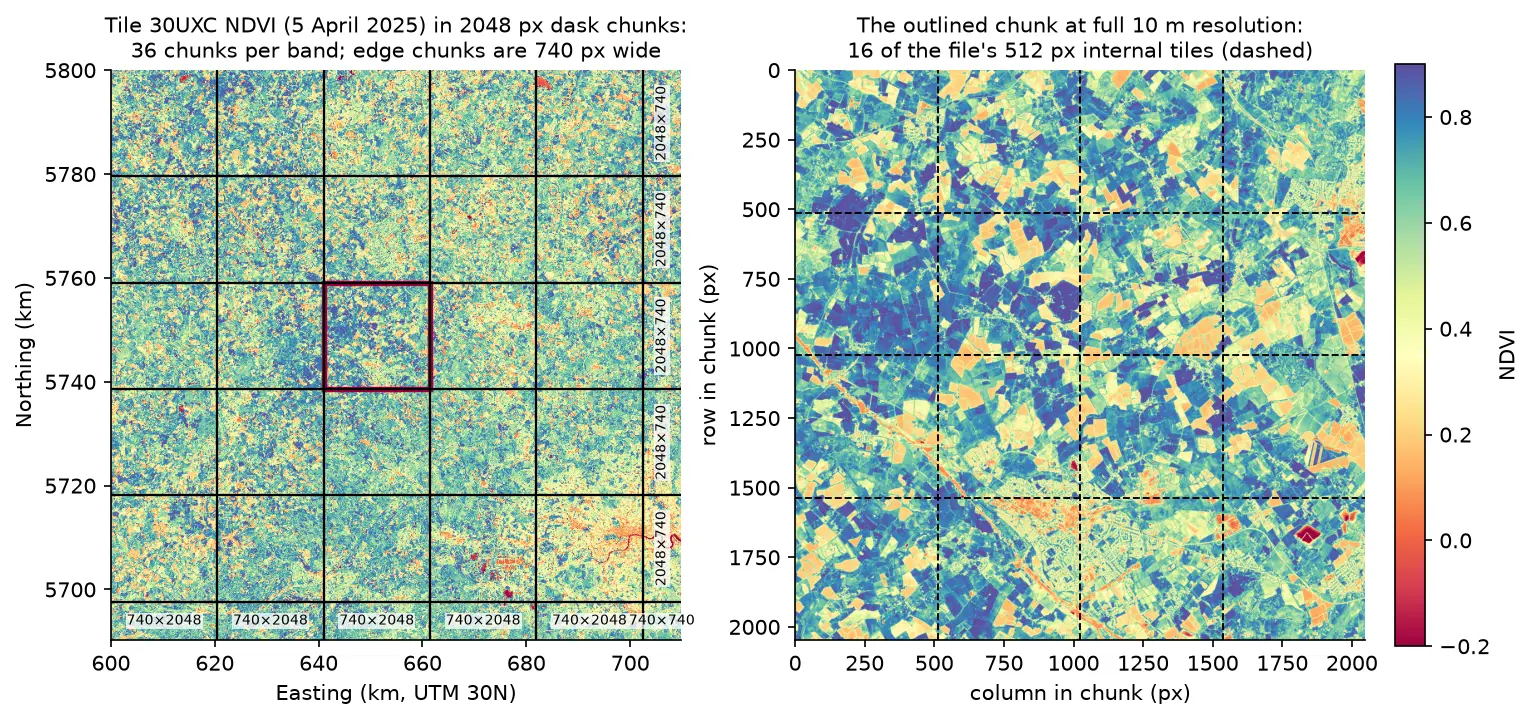
Process large satellite rasters in Python with dask and rioxarray. Open eight full Sentinel-2 scenes lazily, choose a chunk size, inspect the task graph, watch CPU and memory with dask diagnostics, compare peak memory with eager NumPy, time chunk sizes and thread counts, and write a median NDVI GeoTIFF to disk chunk by chunk.
Intermediate 17 min read

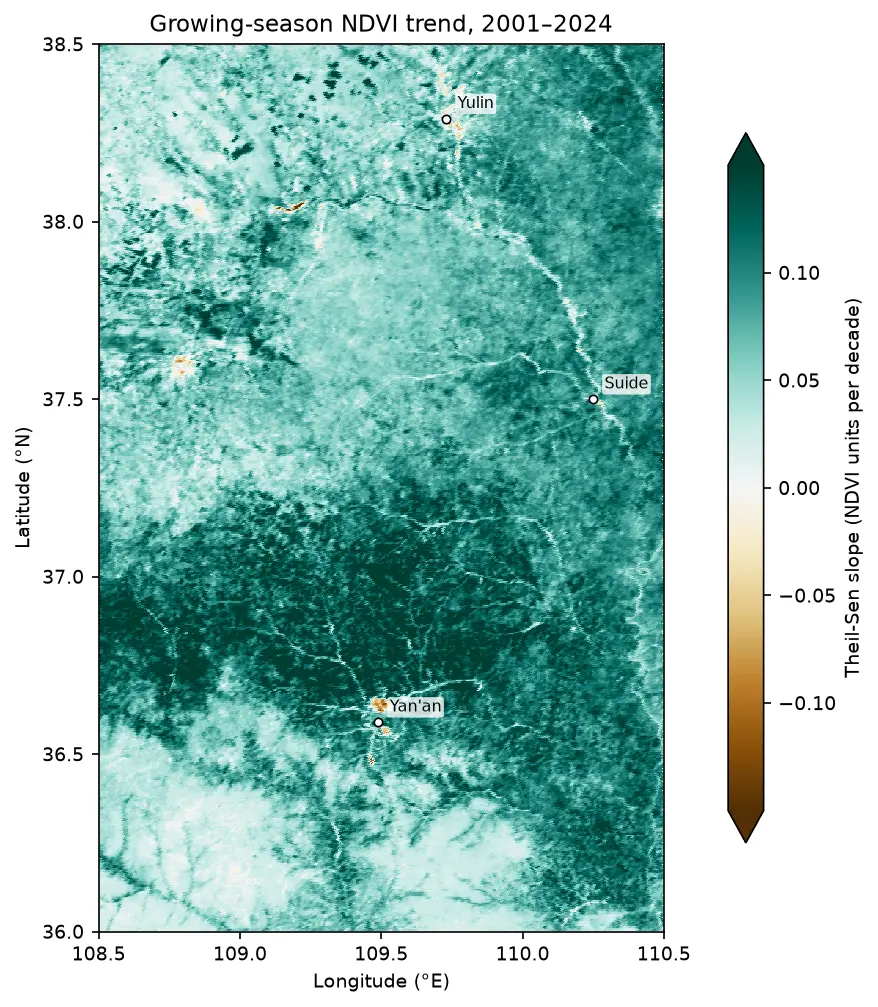
Map of the Theil-Sen slope of growing-season NDVI from 2001 to 2024 on the Loess Plateau between Yan'an and Yulin, almost entirely teal (greening), with a few brown browning patches near Yan'an and Yulin.

Tutorial Remote Sensing

Mann-Kendall trend test on rasters in Python: Theil-Sen NDVI trends with xarray

Run a pixel-wise Mann-Kendall trend test and Theil-Sen slope on 24 years of MODIS NDVI in Python. Read MOD13A1 from the Microsoft Planetary Computer, mask it with the QA layer, aggregate to growing-season means, vectorise the tests with xarray.apply_ufunc (checked against pymannkendall), compare the seasonal and modified Mann-Kendall tests, control the false discovery rate across 229,229 pixels, and map greening and browning on China's Loess Plateau.

Advanced 16 min read

Tutorial Python

Methane plume detection in Python with NASA EMIT: mapping and quantifying landfill plumes

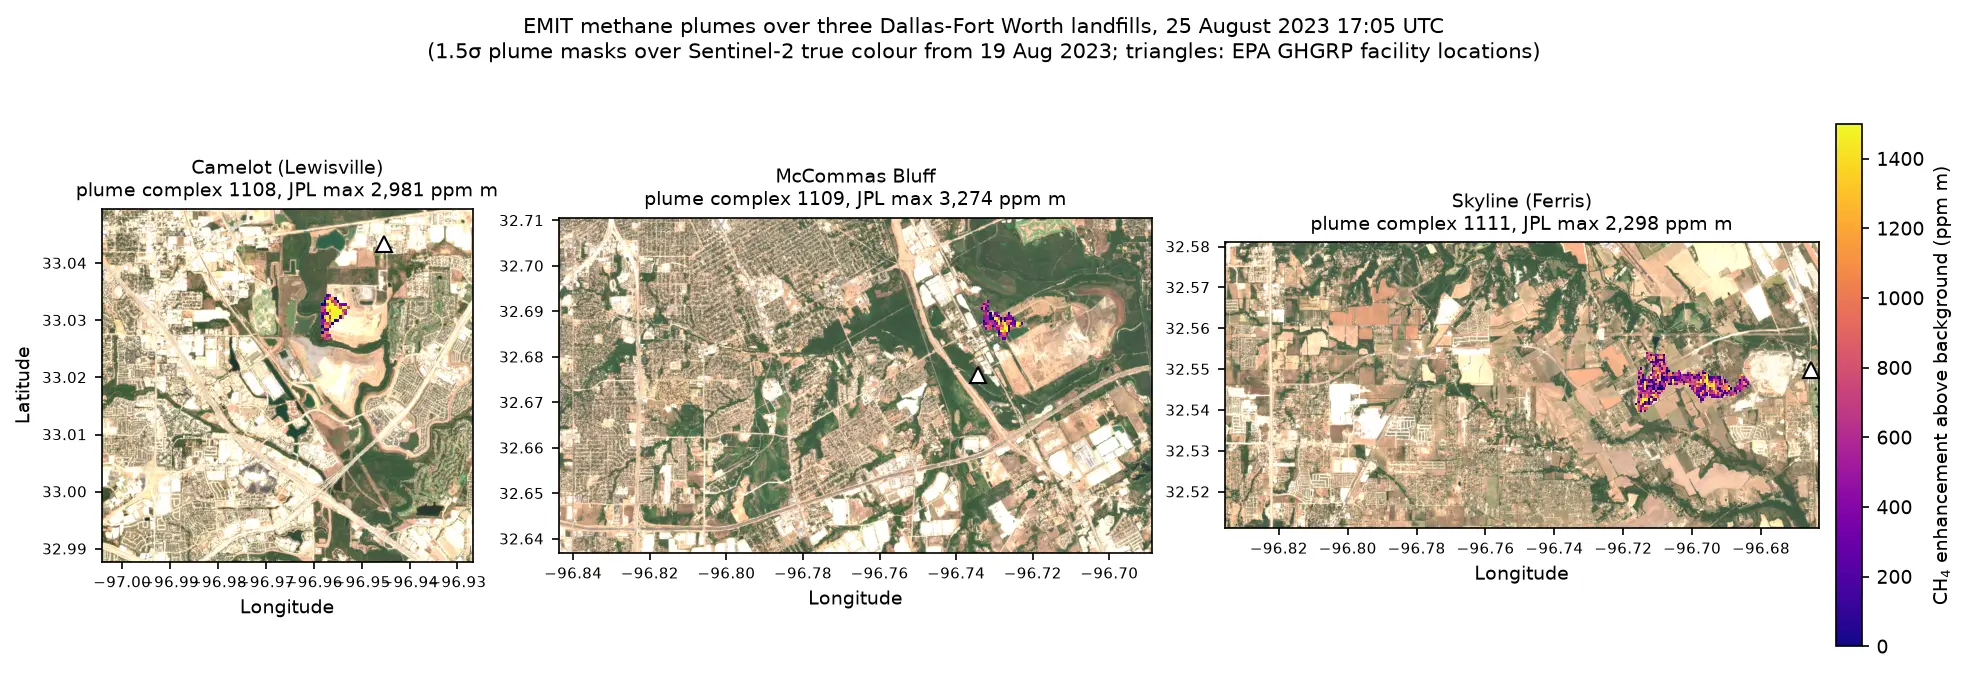
Detect and quantify methane plumes in Python with NASA's EMIT imaging spectrometer: load open EMIT methane enhancement data from NASA VEDA without a login, separate three Dallas-Fort Worth landfill plumes from the noise, compute the integrated mass enhancement, estimate emission rates with ERA5 winds, and compare them with EPA greenhouse gas inventory figures.

Advanced 17 min read

Tutorial Python

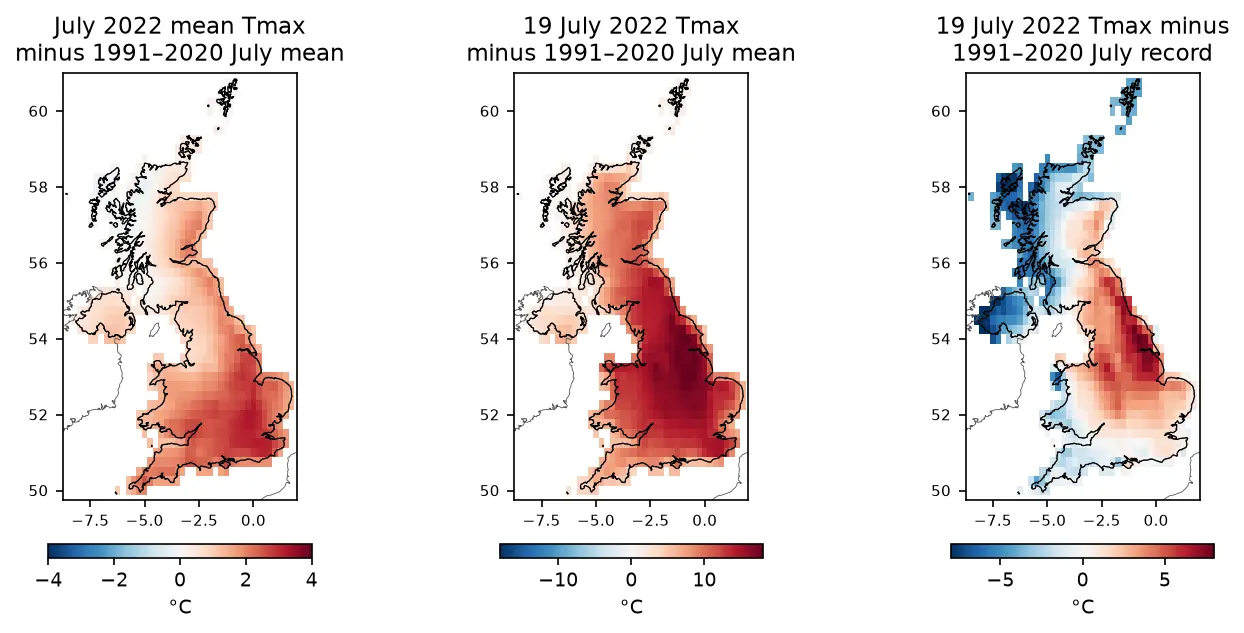
ERA5 in Python with xarray: mapping the July 2022 UK heatwave

Read ERA5 climate reanalysis in Python with xarray from free, login-free cloud Zarr stores, clip it to the UK, compute area-weighted means and anomalies against 1991–2020, export a Cloud Optimised GeoTIFF and check it against Met Office stations.

Intermediate 13 min read

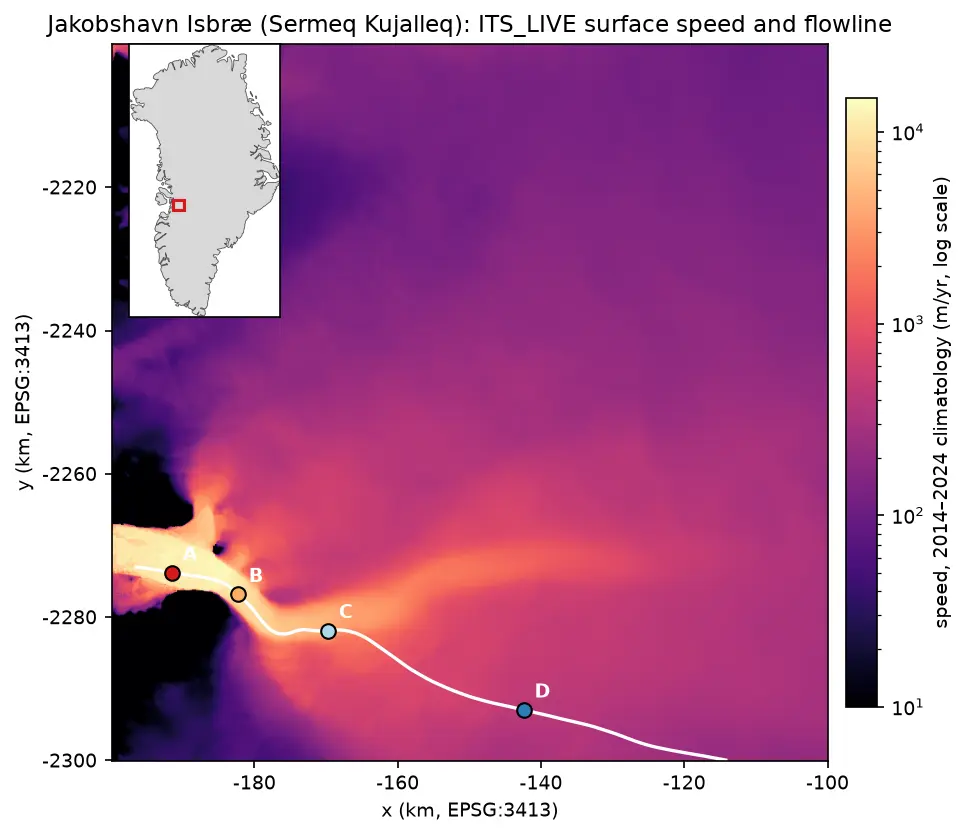
Map of ITS_LIVE surface speed around Jakobshavn Isbræ on a logarithmic colour scale: a narrow channel of ice faster than 10 km per year runs west into the fjord, fed by a broad fan of slower ice from the ice sheet. A white flowline runs up the trunk with points A to D marked at 5, 15, 30 and 60 km, and an inset shows the location on the west coast of Greenland.

Tutorial Python

Glacier velocity in Python with NASA ITS_LIVE: Jakobshavn Isbræ, 1985–2025

Map glacier velocity in Python with NASA's ITS_LIVE Zarr datacubes on AWS, with no login: velocity maps, a flowline traced from the velocity field, 40 years of speed profiles, seasonal and multi-year time series from 80,568 filtered image pairs, and strain rates and flow directions on Jakobshavn Isbræ (Sermeq Kujalleq), Greenland's fastest glacier.

Advanced 15 min read