Fast vector geoprocessing in Python: spatial indexes, overlays and modern file formats
Benchmark point-in-polygon joins, buffers, overlays and dissolves on 200,000 points with GeoPandas and Shapely 2, see why spatial indexes give a 100x+ speed-up, and compare Shapefile, GeoPackage, FlatGeobuf and GeoParquet.
- Level
- Intermediate
- Tested with
- Python 3.8
- Source code
- Download scripts
Key takeaways
- A spatially indexed join (Shapely STRtree or GeoPandas sjoin) assigned 202,062 points to 9,255 grid cells in 0.13–0.25 s, against about 40 s extrapolated for a naive loop, with identical results.
- Coarser buffers (fewer segments per quarter circle) have a quarter of the vertices, which makes every later overlay, union and write cheaper.
- For clean, non-overlapping tilings, shapely.coverage_union_all dissolved more than 5x faster than a standard dissolve.
- GeoParquet was about 5.5x smaller than Shapefile and fastest to read in full; GeoPackage was fastest for bounding-box reads; Shapefile came last on every measure.
Before you start
- Comfortable with GeoPandas basics (see the GeoPandas getting-started tutorial)
- Python 3.8+ with geopandas 0.13+, shapely 2.0+, pyogrio and pyarrow
- About 200 MB of free disk space for the format comparison
GeoPandas code that works on a 500-row sample often grinds to a halt on real data. The cause is almost always the same: a Python loop where a vectorised, spatially indexed operation should be. Since Shapely 2.0, every geometry operation runs on whole NumPy arrays in C (GEOS), and GeoPandas uses it automatically.
This tutorial measures the difference rather than just asserting it. We will:
- generate a realistic dataset: about 200,000 “incident” points clustered around British towns, and a 5 km analysis grid;
- assign points to grid cells three ways (naive loop,
STRtree,sjoin) and time each; - look at the speed/accuracy trade-off for buffers;
- run an
overlayand two flavours of dissolve; - write and read the same data as Shapefile, GeoPackage, FlatGeobuf and GeoParquet.
Every timing below comes from a single run of vector_performance.py on a Windows 11 laptop. Your absolute numbers will differ; the ratios are what matter.
=== versions ===geopandas 0.13.2 | shapely 2.0.7 | GEOS 3.11.4Step 1: build a test dataset
Synthetic data lets you control the size and still get a realistic spatial distribution. We take the British towns from Natural Earth’s 1:10m populated places and scatter 250,000 points around them, weighted by population with an 8 km Gaussian spread. A quarter of the points are spread uniformly as background noise. Everything is in British National Grid (EPSG:27700), so distances are in metres.
countries = gpd.read_file(fetch("ne_50m_admin_0_countries.zip"), engine="pyogrio")uk = countries.loc[countries.ADM0_A3 == "GBR", ["geometry"]].to_crs(27700)gb = uk.explode(index_parts=False).reset_index(drop=True)  # parts share one label until resetgb = gb.loc[[gb.area.idxmax()]]  # the island of Great Britain onlyplaces = gpd.read_file(fetch("ne_10m_populated_places.zip"), engine="pyogrio")towns = places.loc[places.ADM0_A3 == "GBR"].to_crs(27700).clip(gb)
N = 250_000rng = np.random.default_rng(42)w = towns.POP_MAX.to_numpy(float)centre = rng.choice(len(towns), size=N, p=w / w.sum())xy = np.column_stack([towns.geometry.x.to_numpy()[centre], towns.geometry.y.to_numpy()[centre]])xy += rng.normal(scale=8_000, size=(N, 2))noise = rng.random(N) < 0.25  # a quarter of points spread uniformlyminx, miny, maxx, maxy = gb.total_boundsxy[noise] = np.column_stack([rng.uniform(minx, maxx, noise.sum()), rng.uniform(miny, maxy, noise.sum())])points = gpd.GeoDataFrame(    {"id": np.arange(N), "category": rng.choice(["burglary", "vehicle", "criminal damage", "theft"], N),     "value": rng.gamma(2.0, 50.0, N).round(2)},    geometry=gpd.points_from_xy(xy[:, 0], xy[:, 1]), crs=27700)points = points[points.intersects(gb.geometry.iloc[0])].reset_index(drop=True)
There are two vectorised tricks already here. gpd.points_from_xy builds all the points in one call. points.intersects(polygon) tests all 250,000 points against Great Britain at once and keeps only those on land.
The grid is also built without a loop. shapely.box accepts arrays of coordinates:
cell = 5_000gx, gy = np.meshgrid(np.arange(minx // cell * cell, maxx, cell), np.arange(miny // cell * cell, maxy, cell))grid = gpd.GeoDataFrame(geometry=shapely.box(gx.ravel(), gy.ravel(), gx.ravel() + cell, gy.ravel() + cell), crs=27700)grid = grid[grid.intersects(gb.geometry.iloc[0])].reset_index(drop=True)grid["cell_id"] = np.arange(len(grid))grid["region"] = ((grid.geometry.bounds.minx // 100_000).astype(int).astype(str) + "-" + (grid.geometry.bounds.miny // 100_000).astype(int).astype(str))=== test data ===towns used as cluster centres: 48points: 202,062 grid cells: 9,255 regions: 43 id category value geometry0 0 burglary 134.29 POINT (330043.351 657750.024)1 1 criminal damage 101.07 POINT (389617.801 296168.657)2 2 burglary 146.95 POINT (438262.667 513892.769)3 3 vehicle 35.88 POINT (350664.759 393165.710)4 4 burglary 85.89 POINT (203502.102 871590.272)Of the 250,000 generated points, 202,062 fall on Great Britain; the rest fell offshore. The region column is a 100 km grid-square code that we will dissolve on later.
Step 2: point-in-polygon, three ways
The task is to find which of the 9,255 cells contains each point.
The naive loop
This is the version most people write first: for each point, test every polygon.
sample = points.iloc[:2_000]naive = []for pt in sample.geometry: hit = grid.index[grid.contains(pt)] naive.append(hit[0] if len(hit) else -1)grid.contains(pt) is itself vectorised, but it still performs 9,255 full geometry tests per point. We only time 2,000 points and extrapolate the rest.
A Shapely STRtree
An STRtree (Sort-Tile-Recursive R-tree) stores each polygon’s bounding box in a balanced tree. A query first finds the handful of candidate boxes that overlap the point, then runs the exact predicate on those candidates only. Shapely 2 can query an entire array of geometries at once and returns pairs of indices:
tree = shapely.STRtree(grid.geometry.values.data)pt_idx, poly_idx = tree.query(points.geometry.values.data, predicate="within")GeoPandas sjoin
sjoin builds the same STRtree internally (grid.sindex) and returns a joined GeoDataFrame:
joined = gpd.sjoin(points, grid[["cell_id", "geometry"]], how="inner", predicate="within")=== point-in-polygon ===naive loop (2,000 points) 0.393 s -> extrapolated to all points 39.7 sSTRtree.query, all points 0.130 sgpd.sjoin, all points 0.246 smatched 202,062 of 202,062 points; all three methods agreesjoin speed-up over naive loop: ~161x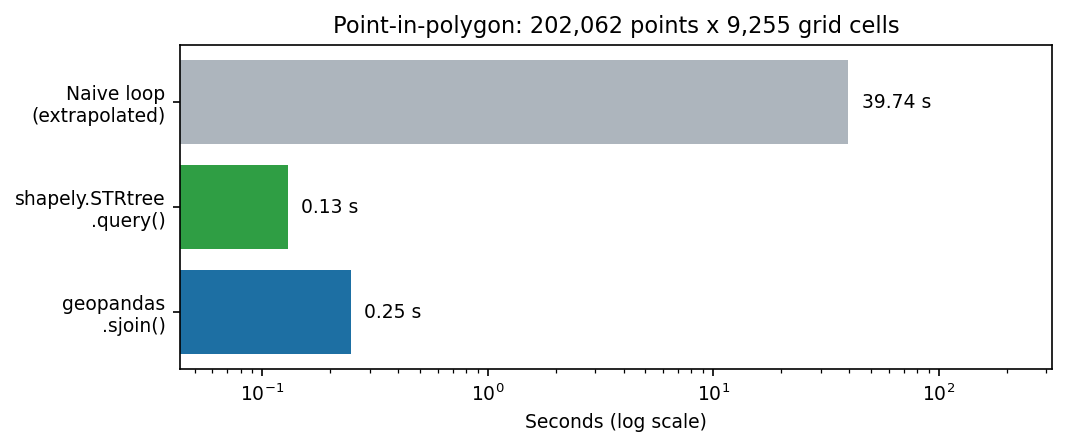
The script asserts that all three methods return the same assignments, so the speed-up costs nothing in correctness. Counting points per cell is then an ordinary pandas groupby:
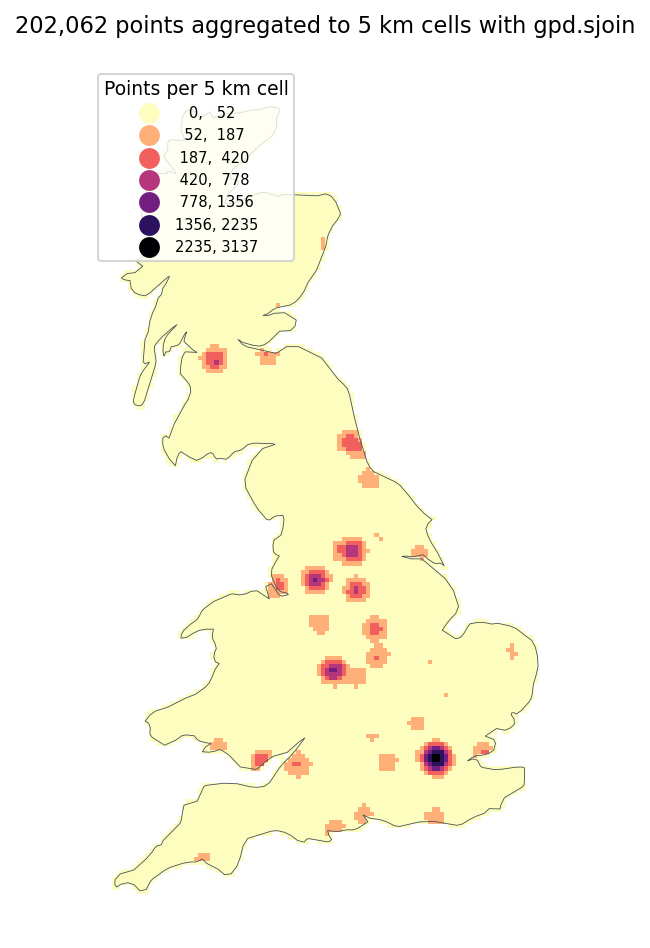
counts = joined.groupby("cell_id").size().rename("n_points")grid = grid.join(counts, on="cell_id").fillna({"n_points": 0}).astype({"n_points": int}) cell_id region n_points1532 1532 5-1 31371593 1593 5-1 30571531 1531 5-1 29351592 1592 5-1 28731533 1533 5-1 2235The five busiest cells are all in 100 km square 5-1 (eastings 500–600 km, northings 100–200 km), which is central London.
Step 3: buffers and quad_segs
A buffer around a point is a polygon that approximates a circle. The resolution argument (called quad_segs in Shapely) sets how many segments make up each quarter circle:
subset = points.iloc[:50_000]b16 = subset.buffer(500) # default: 16 segments per quarter circleb4 = subset.buffer(500, resolution=4)=== buffers ===buffer 500 m, quad_segs=16 (default) 0.442 sbuffer 500 m, quad_segs=4 0.318 svertices per buffer: 65 vs 17; area error of quad_segs=4: 2.55%Creating the buffers is only about 30 % faster, but each polygon has a quarter of the vertices. Every downstream overlay, union and file write gets cheaper as a result. The coarse buffer under-estimates the circle’s area by 2.55 %. Whether that matters depends on your analysis. For a “within roughly 500 m” screen it rarely does.
Step 4: unions and overlays
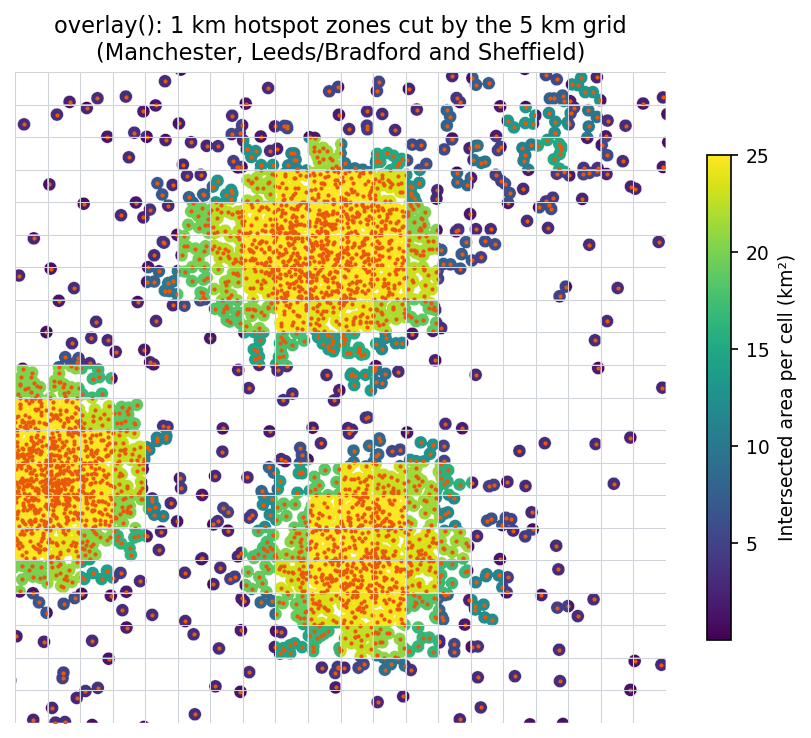
Next, we build “hotspot zones” by buffering 20,000 burglary points by 1 km and merging the overlaps. Then we cut those zones by the grid with overlay:
burglary = points[points.category == "burglary"].iloc[:20_000]zones = gpd.GeoDataFrame(geometry=[burglary.buffer(1_000, resolution=8).unary_union], crs=27700)zones = zones.explode(index_parts=False).reset_index(drop=True)
inter = gpd.overlay(grid[["cell_id", "region", "geometry"]], zones, how="intersection")inter["area_km2"] = inter.area / 1e6cover = inter.groupby("cell_id").area_km2.sum()=== overlay ===buffer + unary_union (20,000 x 1 km) 1.761 smerged into 3,585 hotspot polygonsoverlay(grid, zones, 'intersection') 0.470 s8,373 intersection pieces; 659 cells are more than half coveredunary_union is the expensive step: 20,000 overlapping circles have to be noded together. overlay is fast because it also uses a spatial index, so it only intersects cell–zone pairs whose bounding boxes overlap.
Step 5: dissolve, and a faster union for coverages
dissolve groups rows and unions their geometries. For polygons that tile without overlapping, such as our grid, Shapely 2 offers coverage_union_all. It assumes the input is a valid coverage (no overlaps), so it can simply drop the shared edges:
regions = grid.dissolve(by="region", aggfunc={"n_points": "sum"})cov = {r: shapely.coverage_union_all(g.geometry.values.data) for r, g in grid.groupby("region")}=== dissolve ===dissolve(by='region') [unary_union] 0.197 scoverage_union_all per region 0.035 s43 regions; max area difference between methods: 0.000000 m²The two methods give identical results, but coverage_union_all was more than 5x faster here.
Step 6: choosing a file format
Finally, we write the 202,062 points to four formats. For each one we time a full write, a full read, and a bounding-box read of a 30 × 30 km window around Manchester and Sheffield. The bounding-box read is the operation a web map or a tiled analysis performs.
query_box = box(420_000, 420_000, 450_000, 450_000)points.to_file("points.gpkg", driver="GPKG", engine="pyogrio")   # .shp / .fgb are the samepoints.to_parquet("points.parquet")
sub = gpd.read_file("points.gpkg", engine="pyogrio", bbox=query_box.bounds)sub = gpd.read_parquet("points.parquet"); sub = sub[sub.intersects(query_box)] # gpd 0.13=== file formats === size_MB write_s read_s bbox_read_s bbox_rowsformatShapefile 30.3 2.32 1.31 1.430 9006GeoPackage 23.7 0.71 0.50 0.057 9006FlatGeobuf 29.6 1.58 1.01 0.080 9006GeoParquet 5.4 0.17 0.17 0.180 9006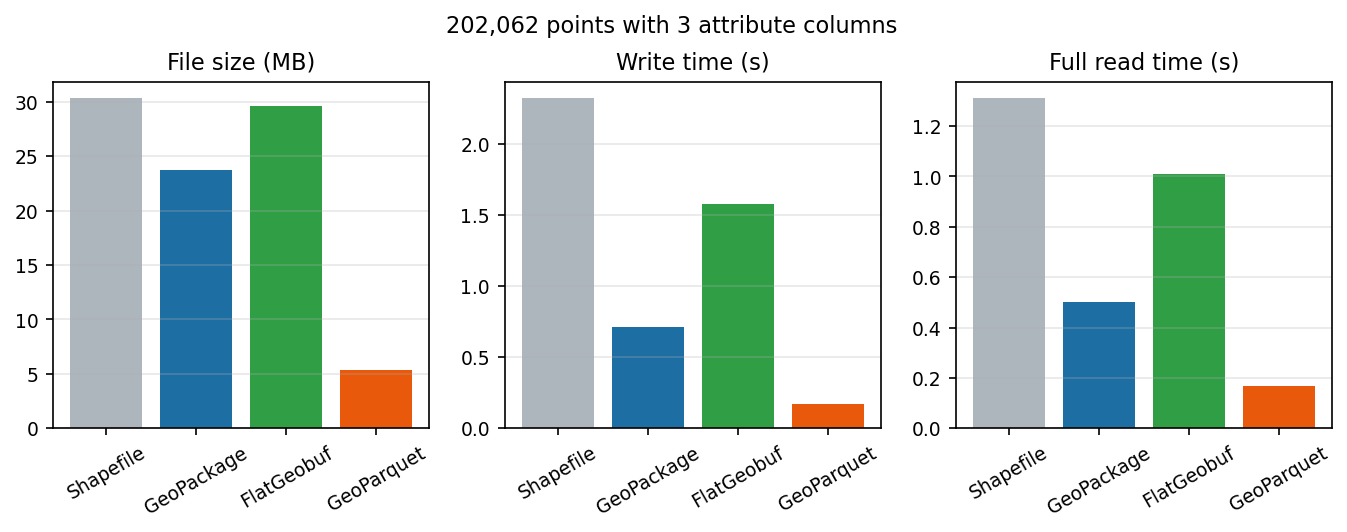
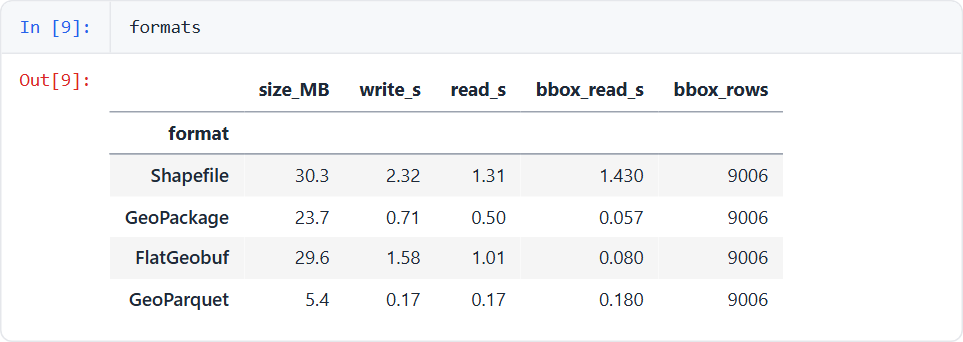
The results tell a clear story:
- GeoParquet is columnar and compressed. It is about 5.5x smaller than a Shapefile and 7–8x faster to read in full. It is the best choice for analysis pipelines and cloud storage. With geopandas 0.13 a bbox read means reading everything and then filtering. geopandas ≥ 1.0 adds
read_parquet(bbox=...), which uses GeoParquet 1.1 bbox covering columns to skip row groups. - GeoPackage has a built-in R-tree, which makes it the fastest at bbox queries here (0.057 s). It is a single file, is the OGC standard and QGIS handles it well. It is the best desktop and interchange format.
- FlatGeobuf also has a spatial index (0.080 s bbox read) and is designed to be streamed over HTTP: a web client can fetch only the bytes for one area from a static file. It is not compact, though.
- Shapefile came last on every measure, and also has a 10-character field-name limit, a 2 GB size limit and needs at least three sidecar files. Use it only when a recipient insists.
Summary: a performance checklist
- Never loop over geometries in Python. Look for the vectorised method on the GeoSeries, or a
shapely.*array function. - Use a spatial index for any “which A is in or near which B” question:
sjoin,sjoin_nearest,sindex.queryorSTRtree. - Work in a projected CRS with metre units before buffering or measuring.
- Reduce vertices early: coarser buffers,
simplify(), or clipping to your study area. - Use
coverage_union_allto dissolve clean, non-overlapping tilings. - Store intermediates as GeoParquet; deliver as GeoPackage, or FlatGeobuf for the web.
Next steps
- Apply these techniques to real data: GIS data sources for the UK lists open crime, boundary and address datasets.
- For data that doesn’t fit in memory, look at dask-geopandas (the same API, partitioned) or DuckDB’s spatial extension, which can query GeoParquet with SQL: query Overture Maps with DuckDB and GeoParquet shows how.
- Turn a result into an interactive map with Folium.
- Once the overlays are fast, test whether the clusters you see are real with hot spot analysis in Python with Getis-Ord Gi* and LISA.
- Revisit the fundamentals behind fast joins: spatial joins in GeoPandas compares predicates,
sjoin_nearestand a naive loop against the spatial index, and coordinate reference systems in Python explains which CRS to measure in.
Data and licences
- Natural Earth 1:50m countries and 1:10m populated places: public domain, naturalearthdata.com.
- The incident points are synthetic, generated by the script with a fixed random seed (42). They are not real crime data.
- Code:
vector_performance.py, tested with Python 3.8.10, geopandas 0.13.2, shapely 2.0.7, pyogrio 0.9.0 and pyarrow 17.0.0.
Key terms
- Spatial index
- A data structure (here an STRtree, a kind of R-tree) that stores bounding boxes so a query only runs exact geometry tests on nearby candidates.
- Vectorised operation
- One call that processes whole arrays of geometries in compiled code, instead of a Python loop over individual features.
- Coverage
- A set of polygons that tile an area without overlaps, such as a grid or administrative boundaries.
- GeoParquet
- A columnar, compressed file format for vector data built on Apache Parquet, suited to analysis pipelines and cloud storage.
Data for this tutorial
- Natural Earth · Public-domain countries and populated places
- GIS data sources for the United Kingdom
Licences and formats for each source are listed in the GIS data sources catalogue.