#Copernicus DEM

11 posts

Tutorial Python Part 5 of 5

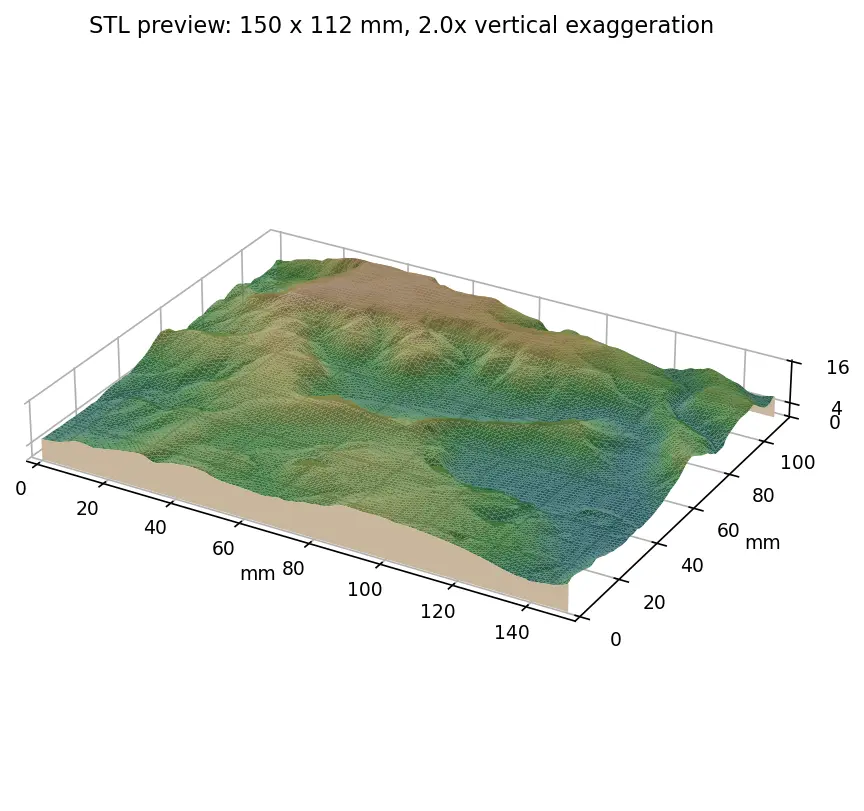
Tiling a large 3D-printed terrain model: jigsaw joints and dowel pins in Python

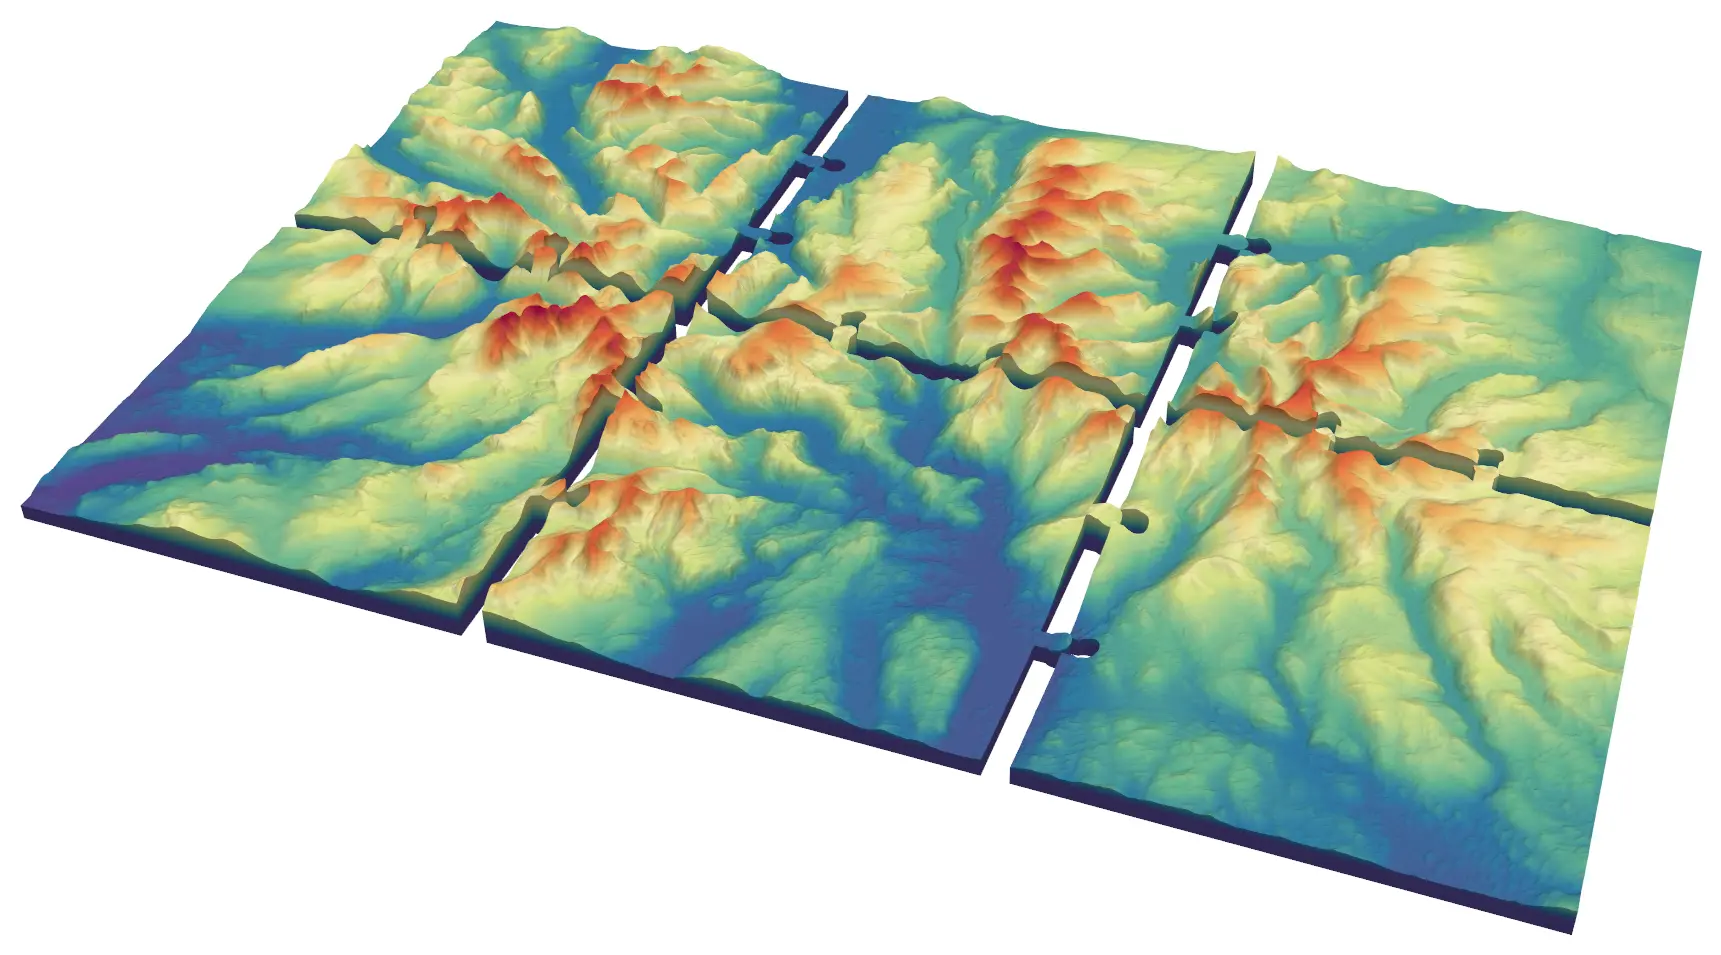
Split a 45 × 30 km model of the central Lake District into six interlocking 150 mm tiles from Copernicus GLO-30, with jigsaw knobs and a 0.2 mm printing clearance or straight edges and filament dowels, and prove every tile is watertight and fits its neighbours.
Advanced 9 min read

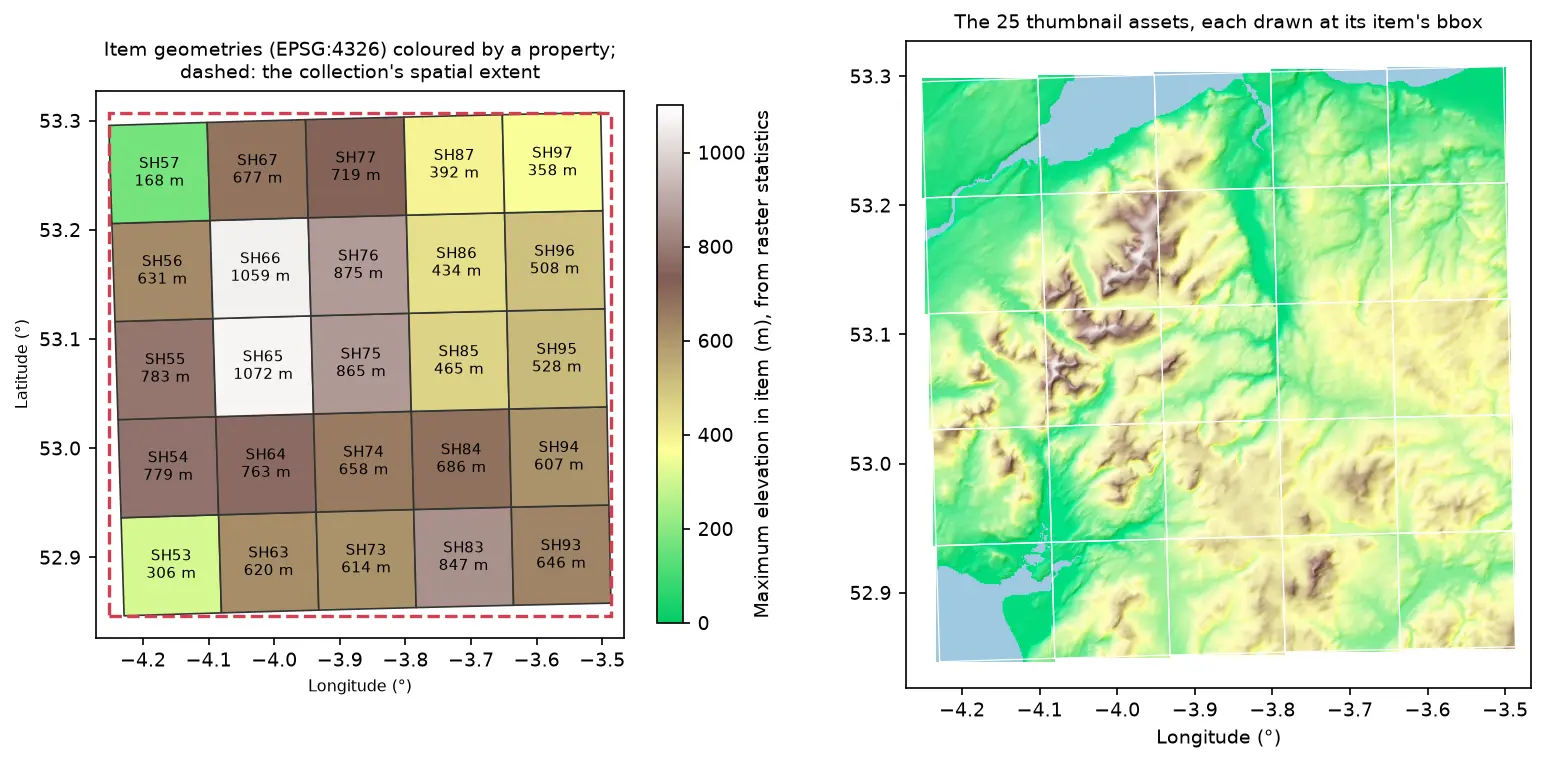
Two maps of Eryri in longitude and latitude. Left: 25 slightly rotated STAC item footprints labelled SH53 to SH97 and coloured by maximum elevation, inside a dashed red collection extent. Right: the 25 hillshaded thumbnail assets drawn at their item bounding boxes, forming one relief map

Tutorial Python Part 2 of 2

Build a STAC catalogue in Python with pystac, rio-stac and pystac-client

Turn 25 Cloud Optimised GeoTIFFs of Eryri into a static STAC catalogue with pystac and rio-stac, validate it against the JSON schemas, query it, serve it as static files, and compare it with the Earth Search and Planetary Computer STAC APIs through pystac-client.

Intermediate 12 min read

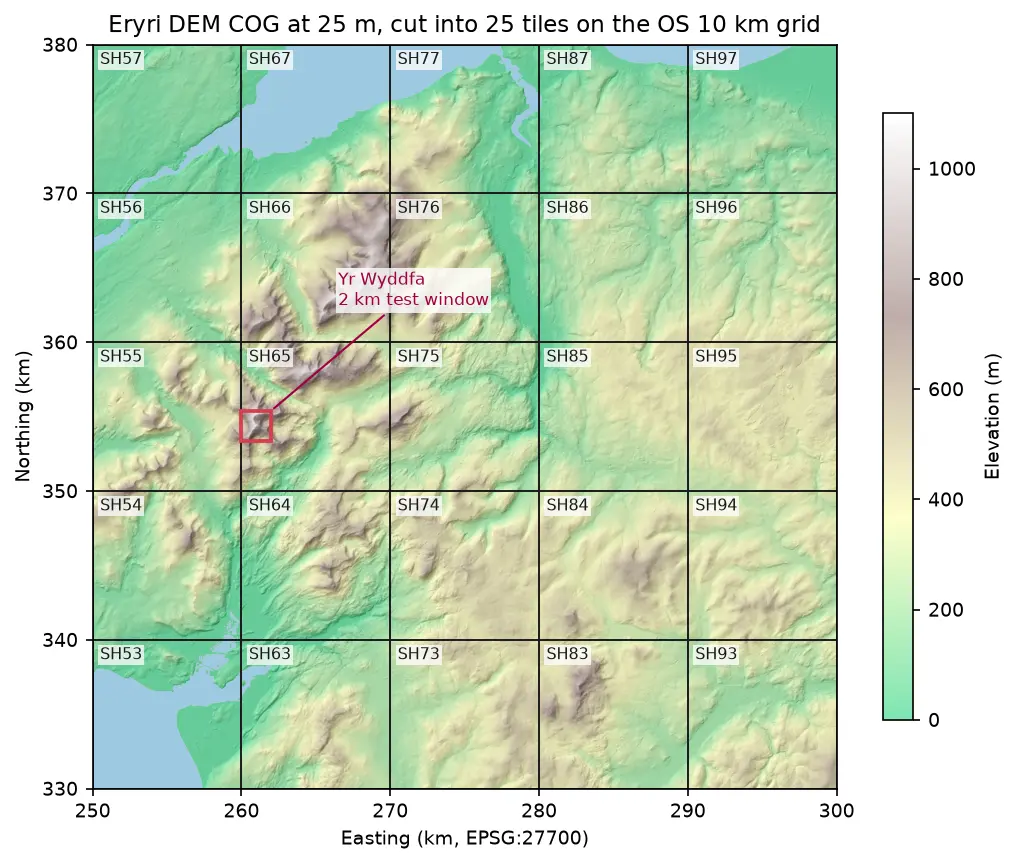
Hillshaded elevation map of Eryri at 25 m in British National Grid, coloured from green lowland to white summits, divided into 25 labelled 10 km squares from SH53 to SH97, with a red 2 km box marking the Yr Wyddfa test window

Tutorial Python Part 1 of 2

Cloud Optimised GeoTIFFs in Python: reproject, mosaic and validate a COG

Mosaic four Copernicus DEM GLO-30 tiles straight from AWS with rasterio, reproject them to British National Grid, write a validated Cloud Optimised GeoTIFF with rio-cogeo, and measure exactly how many bytes HTTP range requests fetch.

Intermediate 12 min read

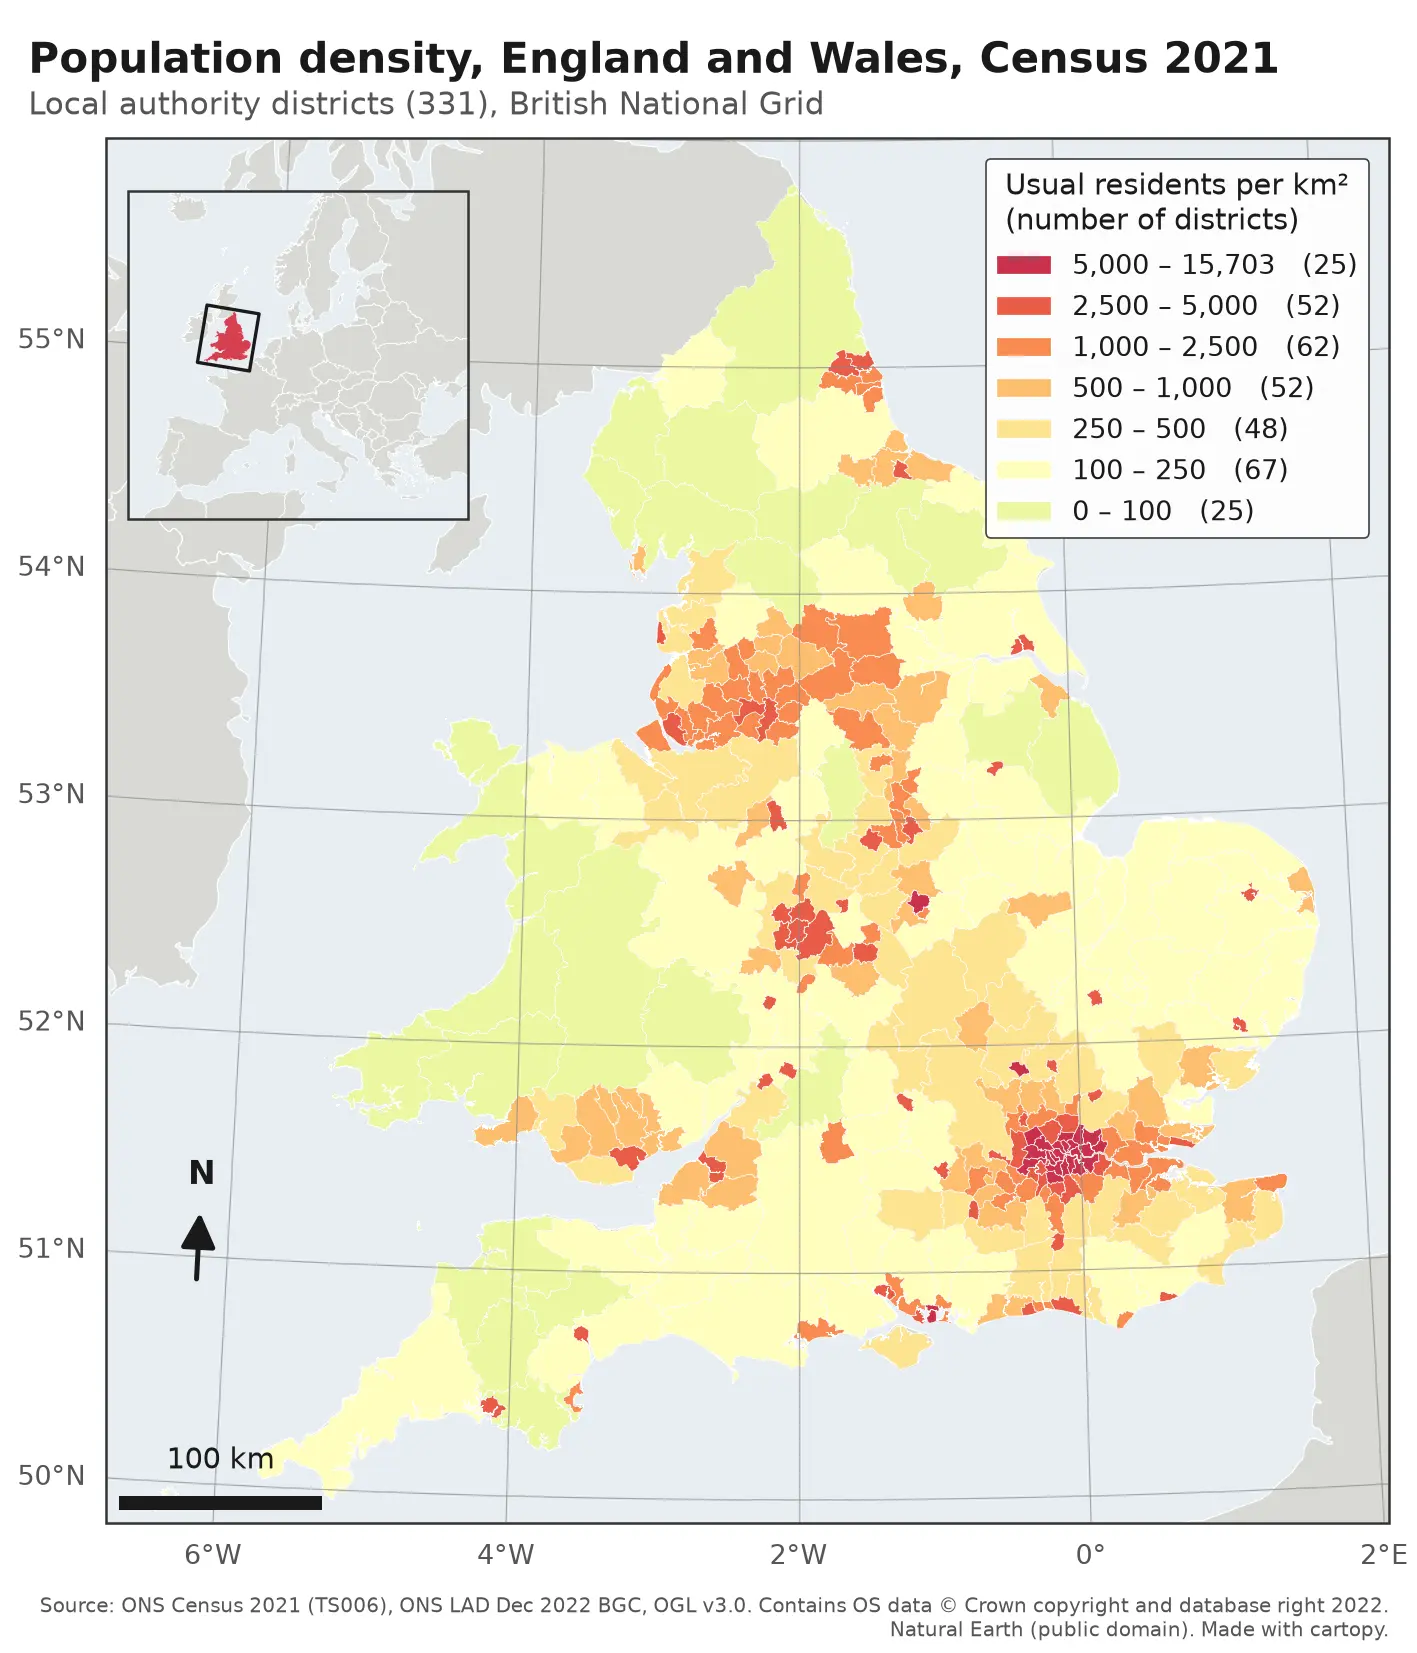
Choropleth map of population density in the 331 local authority districts of England and Wales from Census 2021, in seven classes from pale yellow (under 100 residents per km²) to deep red (over 5,000). London, Birmingham, Manchester, Liverpool, Leeds, Newcastle and the south coast cities stand out in red; Wales, Cumbria, Northumberland and Lincolnshire are pale. The map has a classified legend, a 100 km scale bar, a north arrow, latitude and longitude labels and an inset locator map of Europe.

Tutorial Python

Make a map in Python with matplotlib and cartopy: projections, classified choropleths, scale bars, north arrows and inset maps

A cartopy tutorial for publication-quality maps in Python: choose a projection, draw a classified choropleth of Census 2021 population density with a proper legend, add a scale bar, a true-north arrow, an inset locator map and gridlines, style it for light and dark backgrounds, export at 300 dpi to PNG, PDF and SVG, and shade the Copernicus DEM for Greater Manchester.

Beginner 14 min read

Tutorial Python Part 1 of 3

Coordinate reference systems in Python: EPSG codes, pyproj transforms and reprojecting vectors and rasters

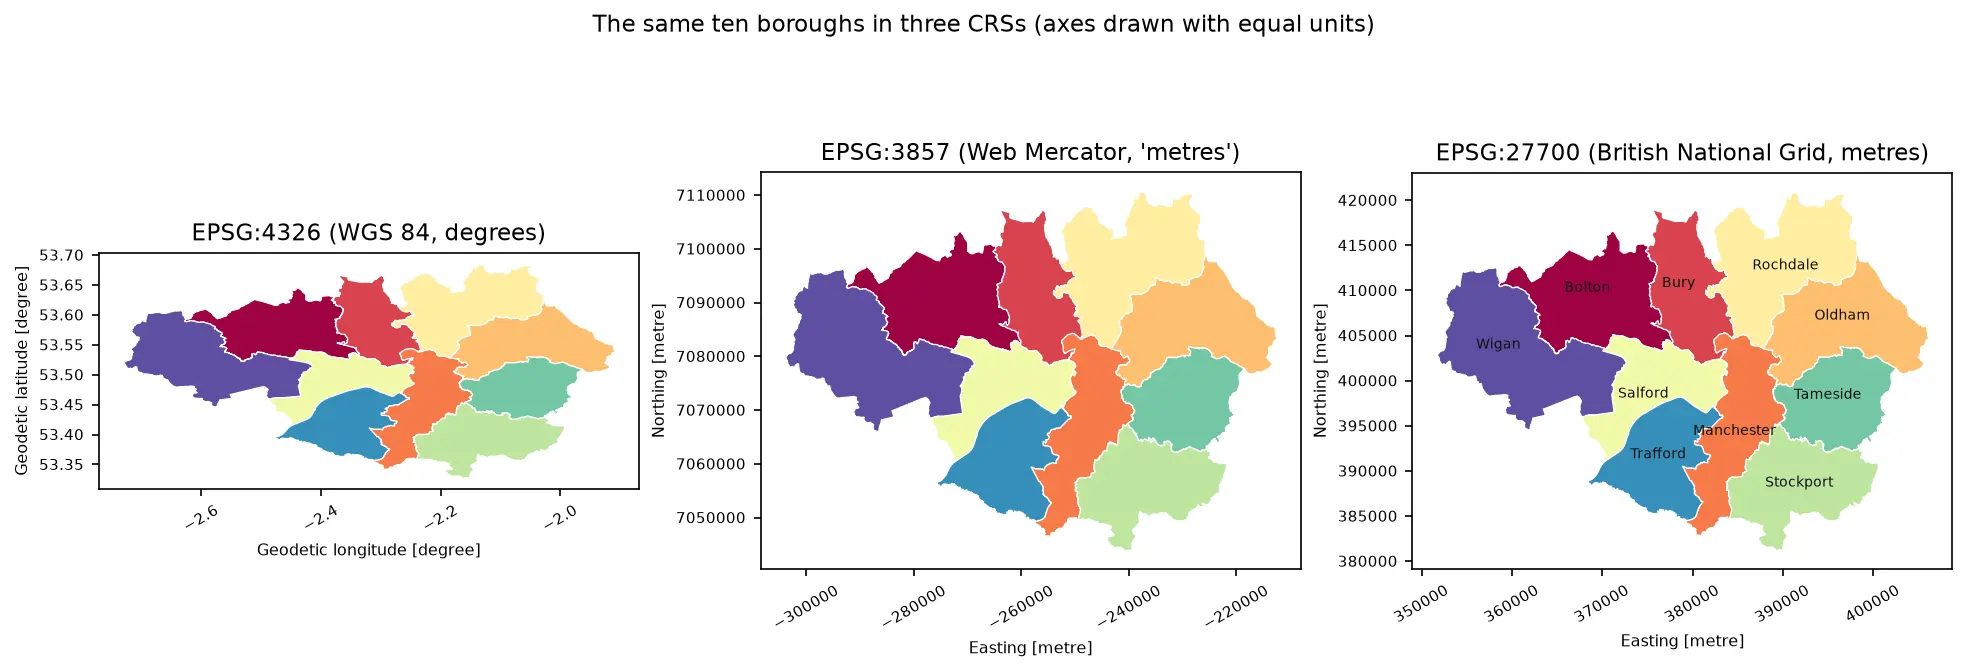
A practical guide to coordinate reference systems in Python with pyproj, GeoPandas and rasterio, tested on real Greater Manchester data. Covers EPSG codes, WGS 84 vs British National Grid (EPSG:27700), the always_xy axis-order trap, OSTN15 vs Helmert datum shifts checked against 13,187 NaPTAN bus stops, measured area and distance errors in the wrong CRS, and reprojecting a GeoDataFrame and a Copernicus DEM raster.

Beginner 13 min read

Tutorial Python

Viewshed analysis in Python: line of sight and a wind farm ZTV with GDAL and numpy

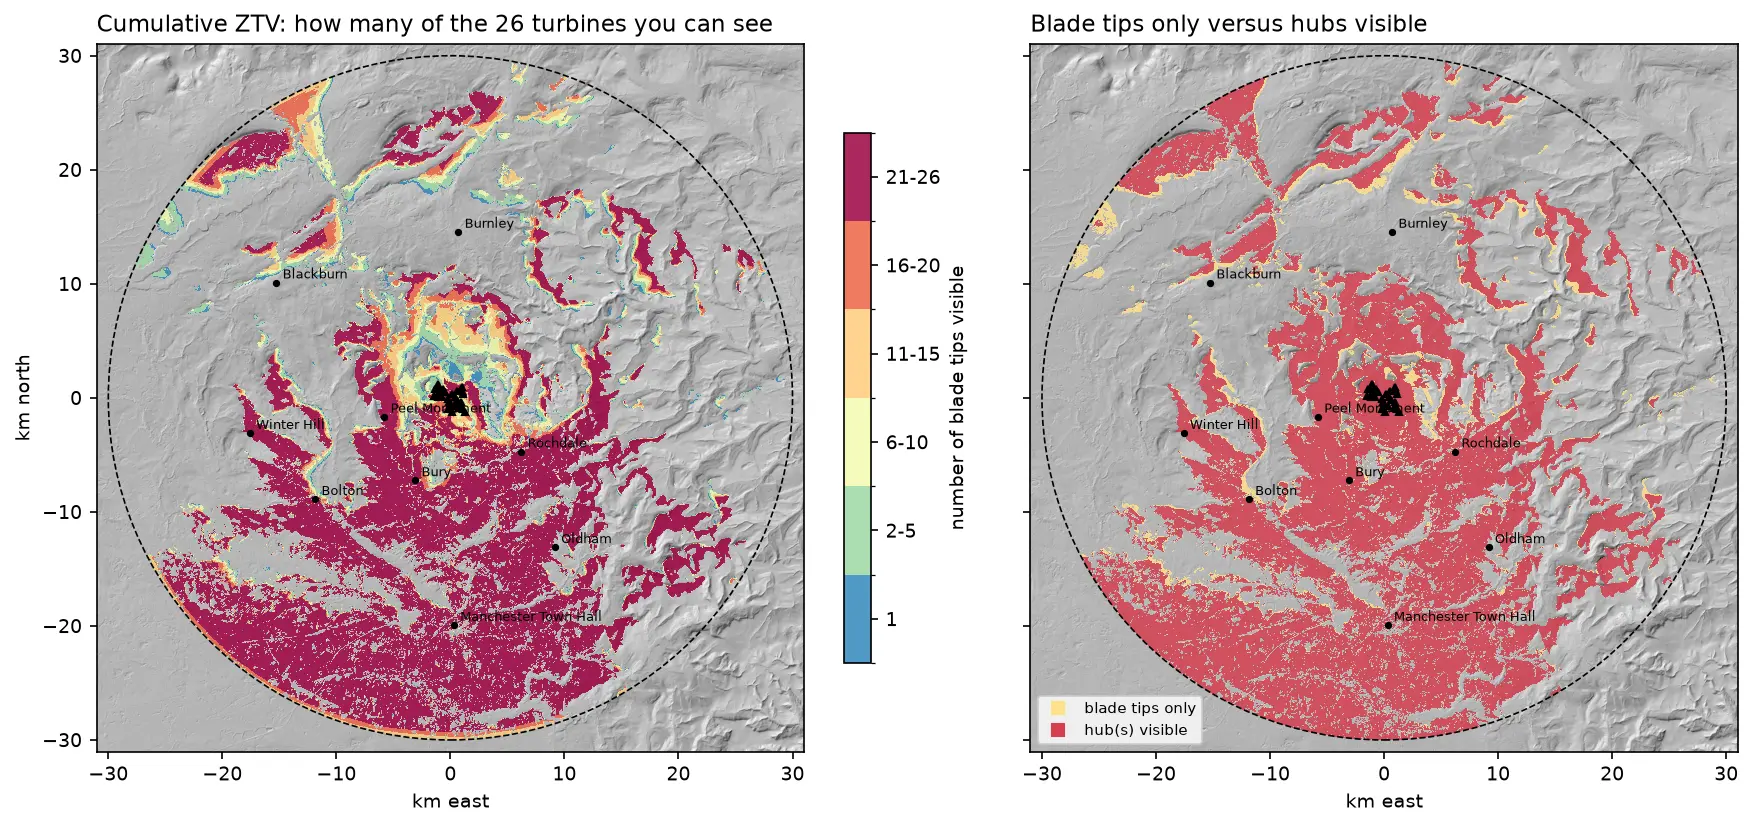
Run a viewshed analysis in Python on a real DEM: compute what one wind turbine can see with gdal.ViewshedGenerate, rebuild the same line-of-sight algorithm in numpy, correct for earth curvature and refraction, build a cumulative zone of theoretical visibility (ZTV) from 26 turbines, draw line-of-sight profiles, and measure how much trees and buildings in a LiDAR DSM shrink a bare-earth viewshed.

Intermediate 16 min read

Tutorial Python

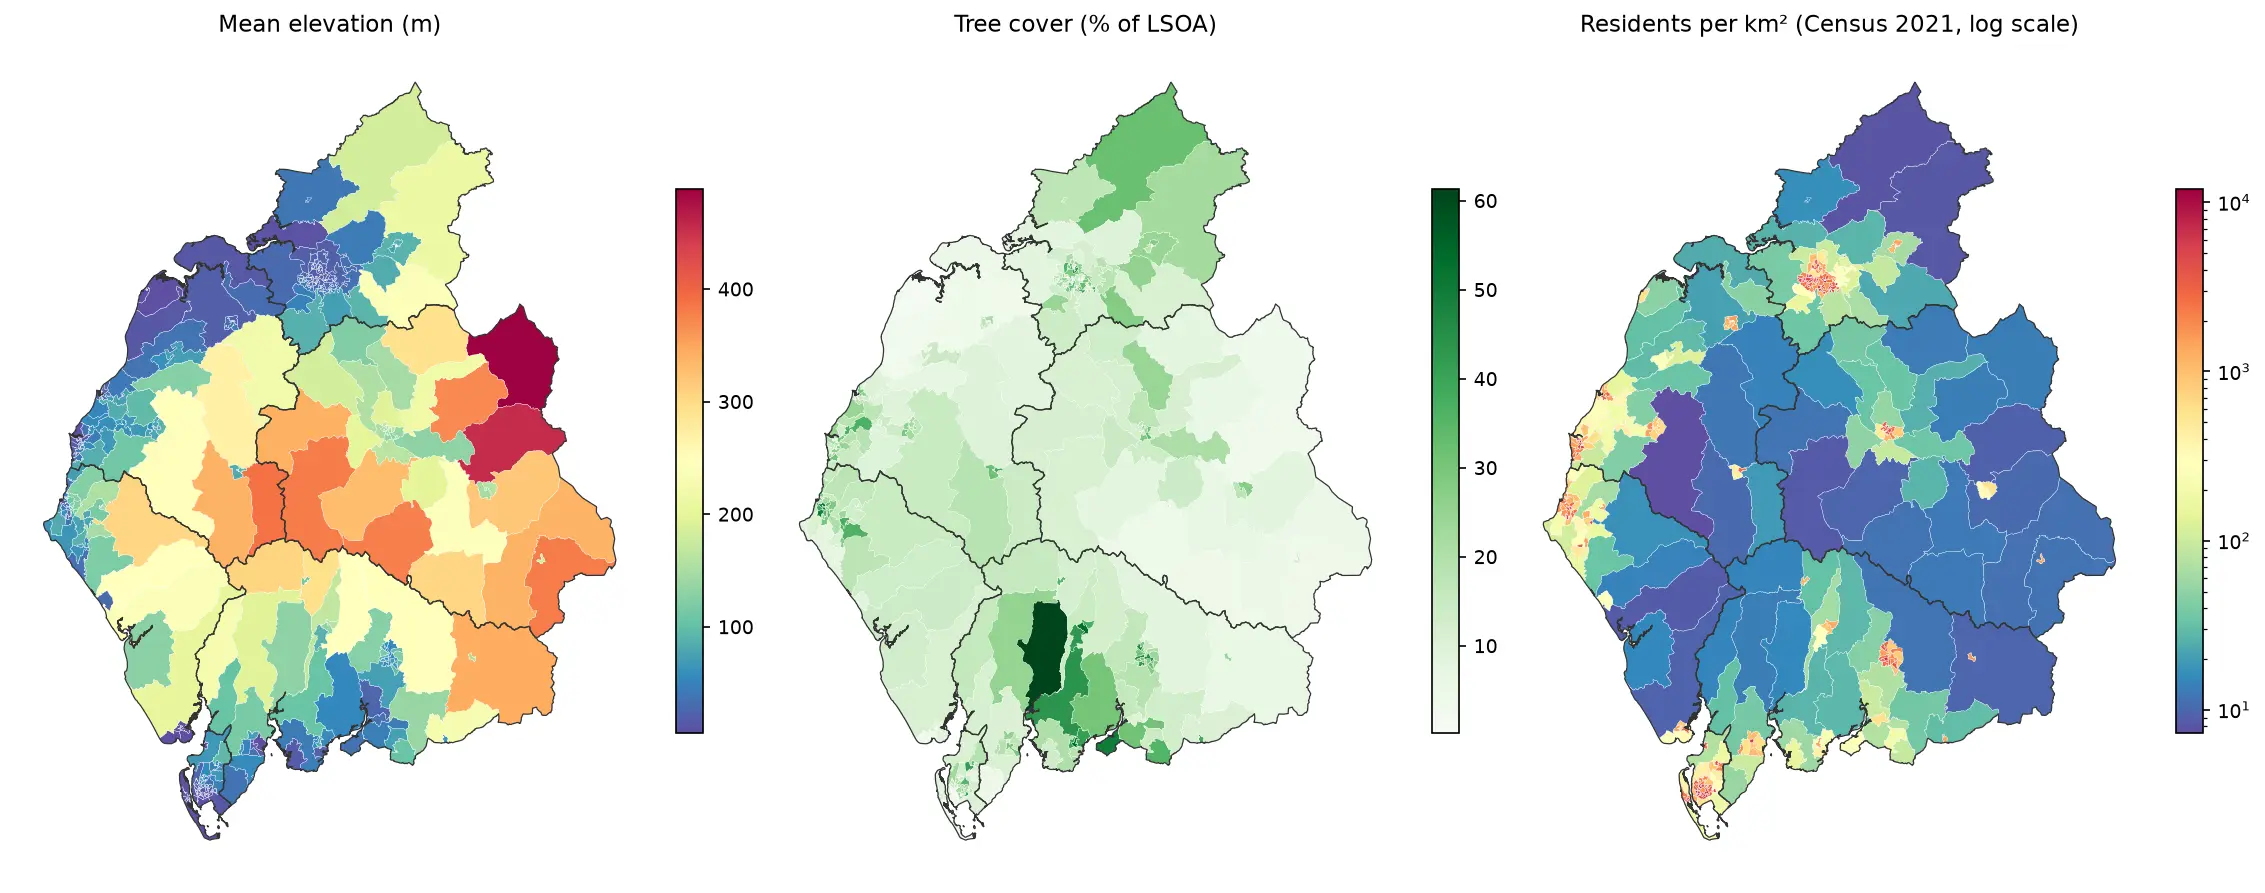
Zonal statistics in Python: exactextract vs rasterstats, with partial pixels, land-cover fractions and a benchmark

Calculate zonal statistics in Python with exactextract and rasterstats on real data: ONS 2021 LSOA boundaries for Cumbria with GHSL population, the Copernicus DEM and ESA WorldCover. Covers partial-pixel weighting vs pixel centroids, CRS alignment, categorical land-cover fractions, a speed benchmark, GeoPackage export and choropleth maps.

Intermediate 14 min read

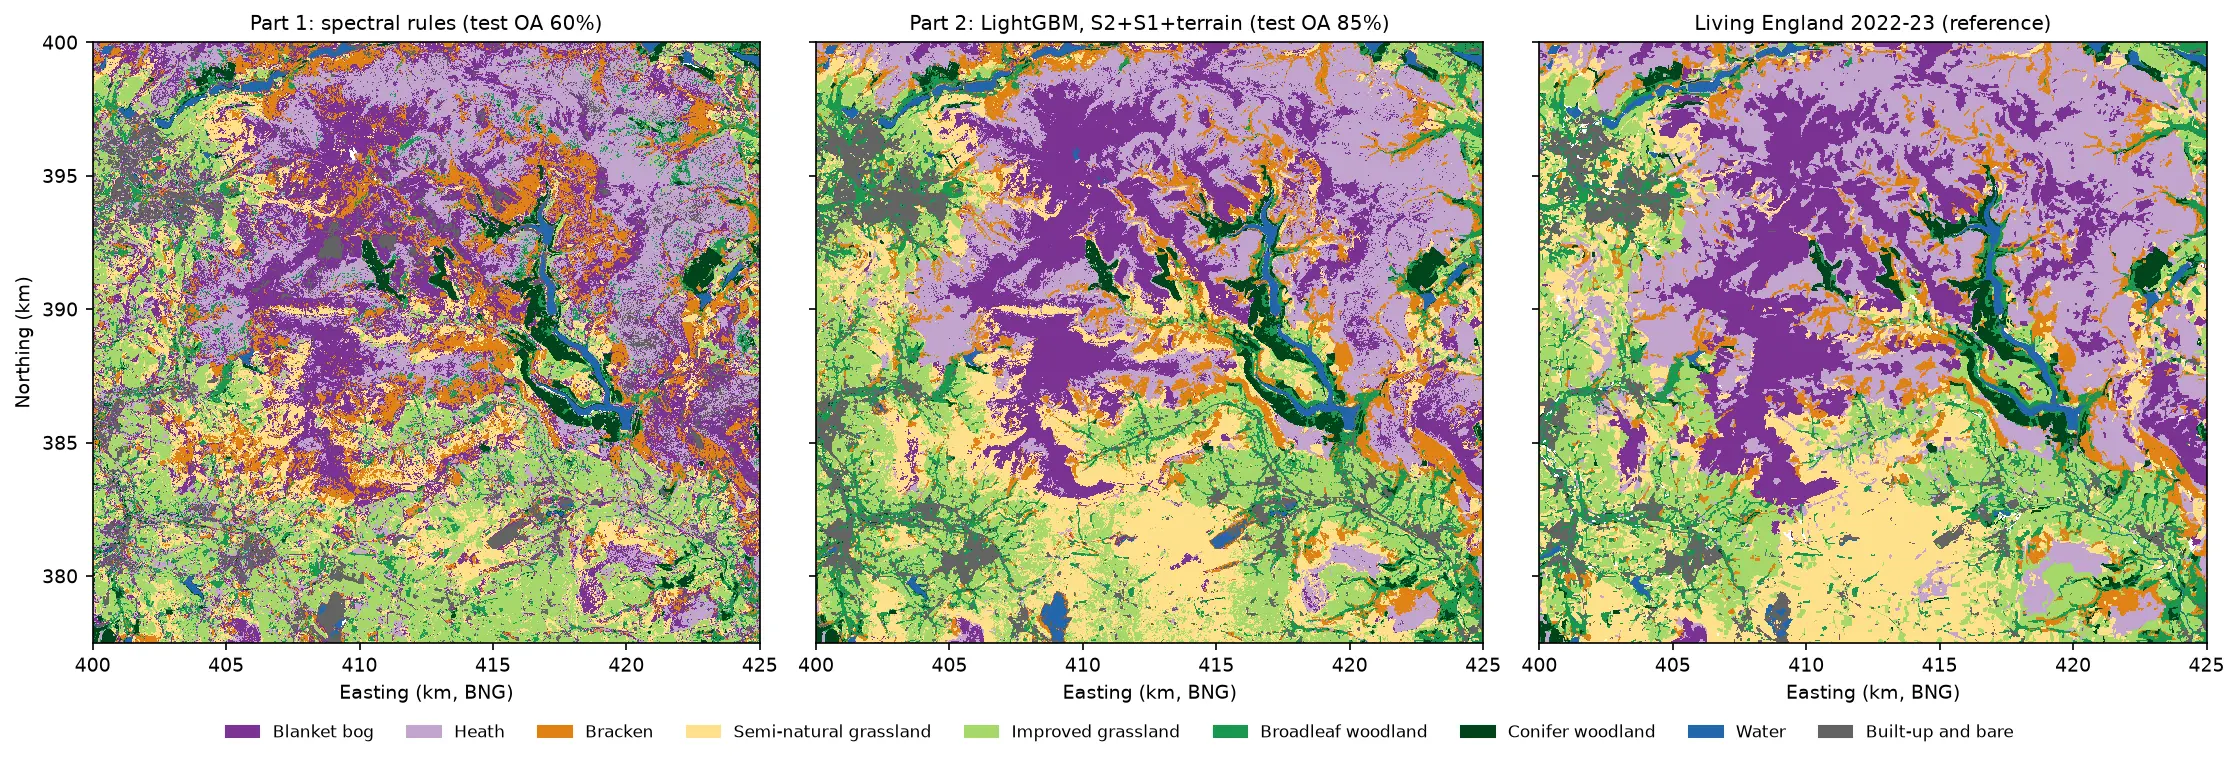
Three habitat maps of the Dark Peak side by side. Left: the noisy Part 1 rule-based map. Centre: the LightGBM map, with smooth purple blanket bog on the Kinder and Bleaklow plateaux, lilac heath around them, orange bracken on the valley sides, yellow semi-natural grassland in the south, green grassland and woodland in the valleys and blue reservoirs. Right: Living England 2022-23, which the LightGBM map closely resembles.

Tutorial Python Part 2 of 5

Habitat classification with LightGBM in Python: Sentinel-2, Sentinel-1 and terrain fusion

Classify nine upland habitats in the Peak District with LightGBM on 77 multi-temporal features: seasonal Sentinel-2 bands and indices, Sentinel-1 VV and VH backscatter and Copernicus DEM terrain. Tune with spatial-fold cross-validation and class weights, run an S2 / S2+S1 / S2+S1+terrain ablation, explain the model with TreeSHAP and permutation importance, and compare it with a random forest and the Part 1 rules on the same test blocks.

Intermediate 21 min read

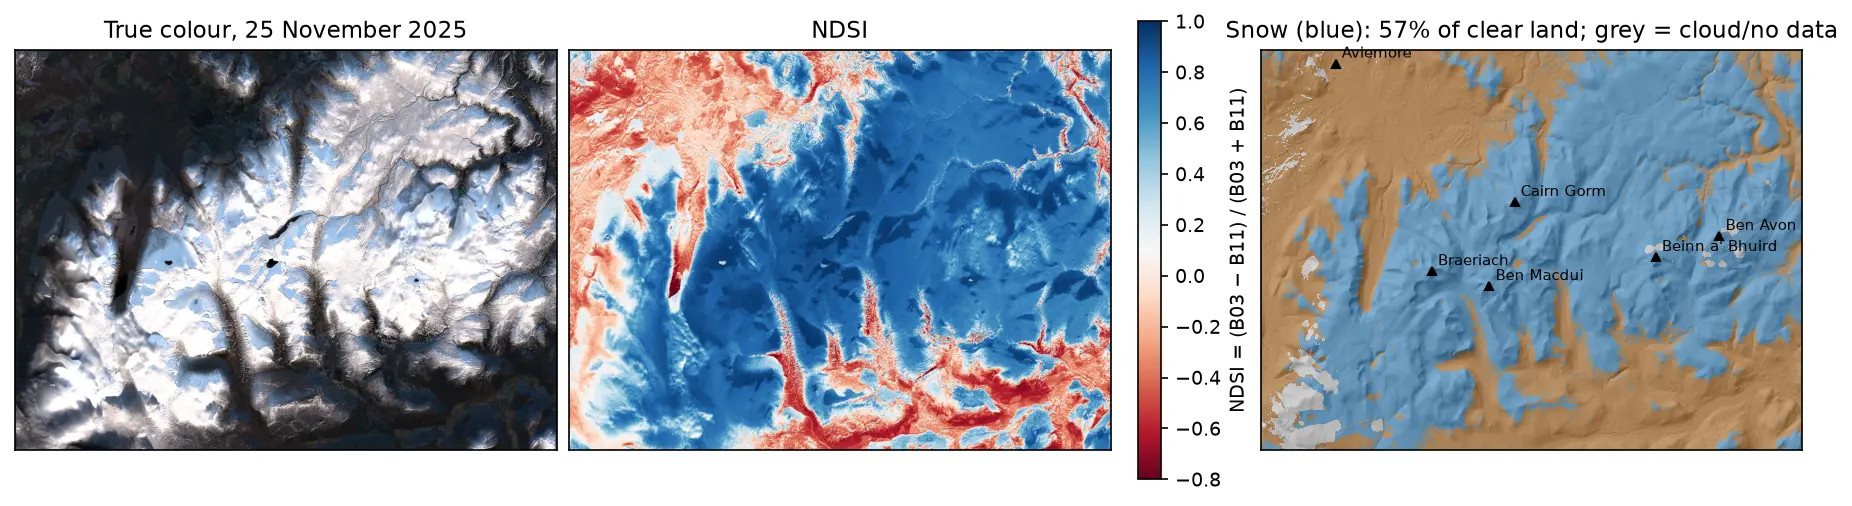
Three panels of the Cairngorms on 25 November 2025: a true-colour Sentinel-2 image with snow on the plateaux and long shadows in the glens; the NDSI, blue over snow and red over forest and bare ground; and a snow map over hillshade, with snow in blue on the high ground around Cairn Gorm, Ben Macdui, Braeriach, Beinn a' Bhuird and Ben Avon, covering 57% of the clear land.

Tutorial Python

Snow cover mapping with NDSI in Python: Sentinel-2 and MODIS over the Cairngorms

Map snow cover in Python with the Normalised Difference Snow Index (NDSI) from Sentinel-2 and the daily MODIS snow product on the Microsoft Planetary Computer: choosing the NDSI threshold, separating snow from cloud, snow-covered area through the winter of 2025–26 in the Cairngorms, and the snowline by elevation and aspect with the Copernicus DEM.

Intermediate 15 min read

Tutorial Python Part 1 of 5

From DEM to 3D-printable STL with Python and NumPy

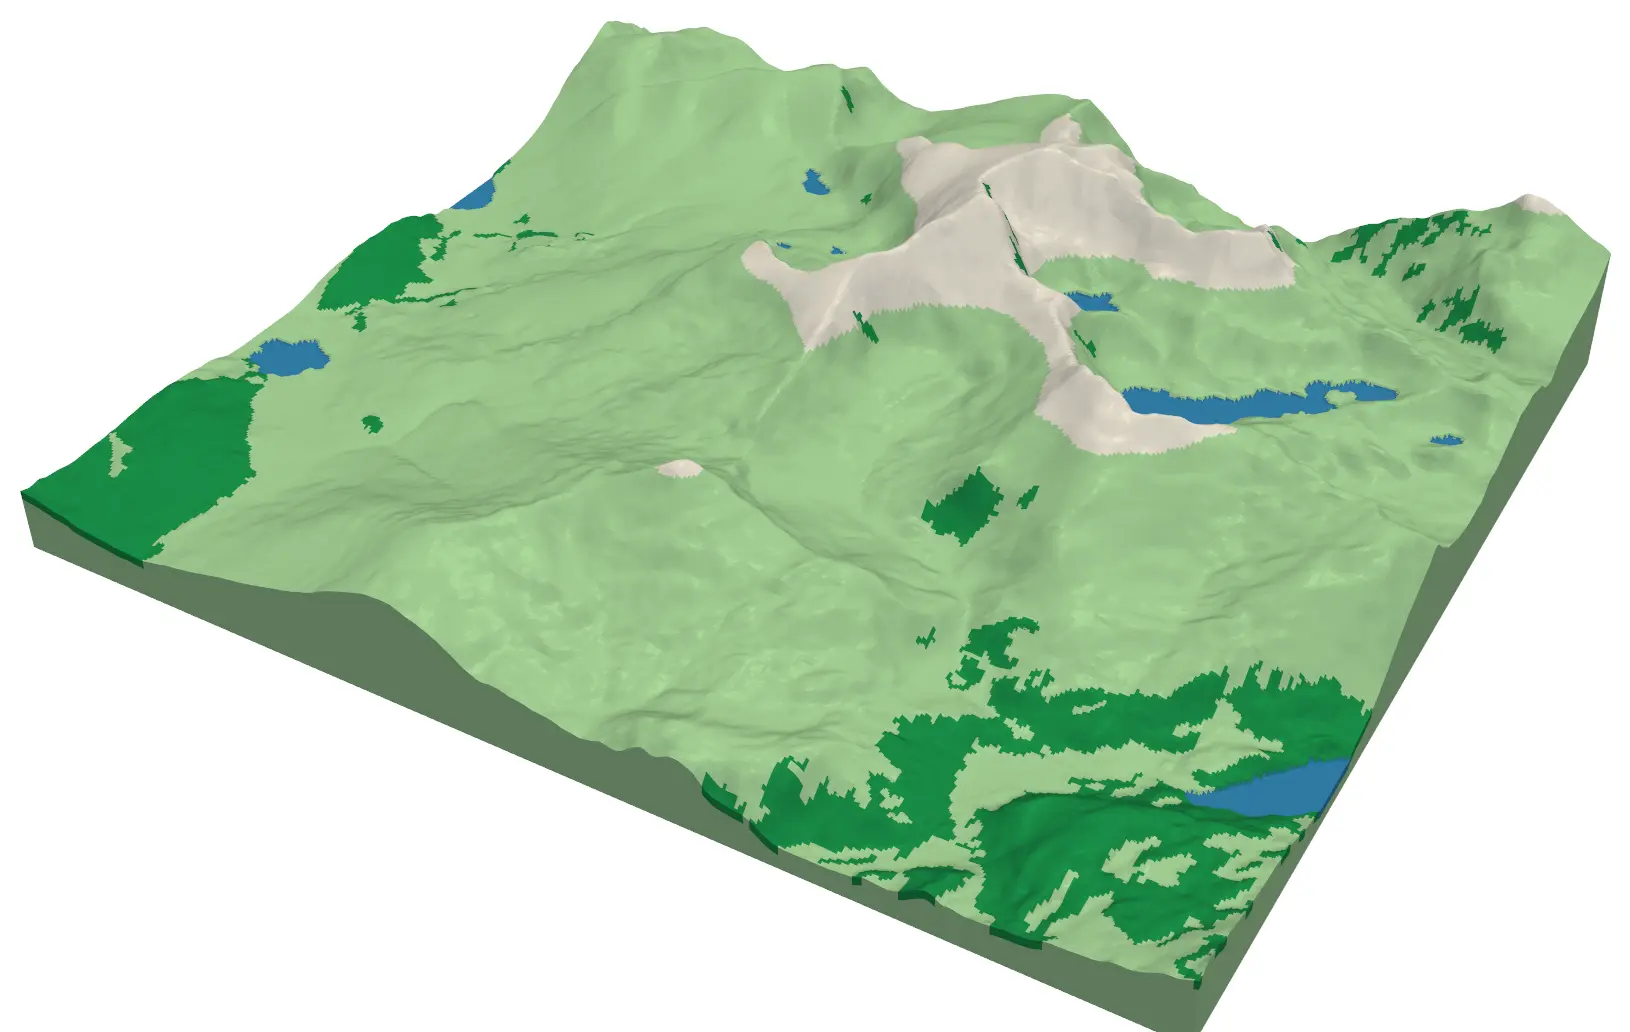
Stream a Copernicus 30 m DEM of the Edale valley, reproject it to British National Grid, scale it to a 150 mm print and write a watertight binary STL using only NumPy, with checks that prove the mesh is printable.

Intermediate 6 min read