#Environment Agency

9 posts

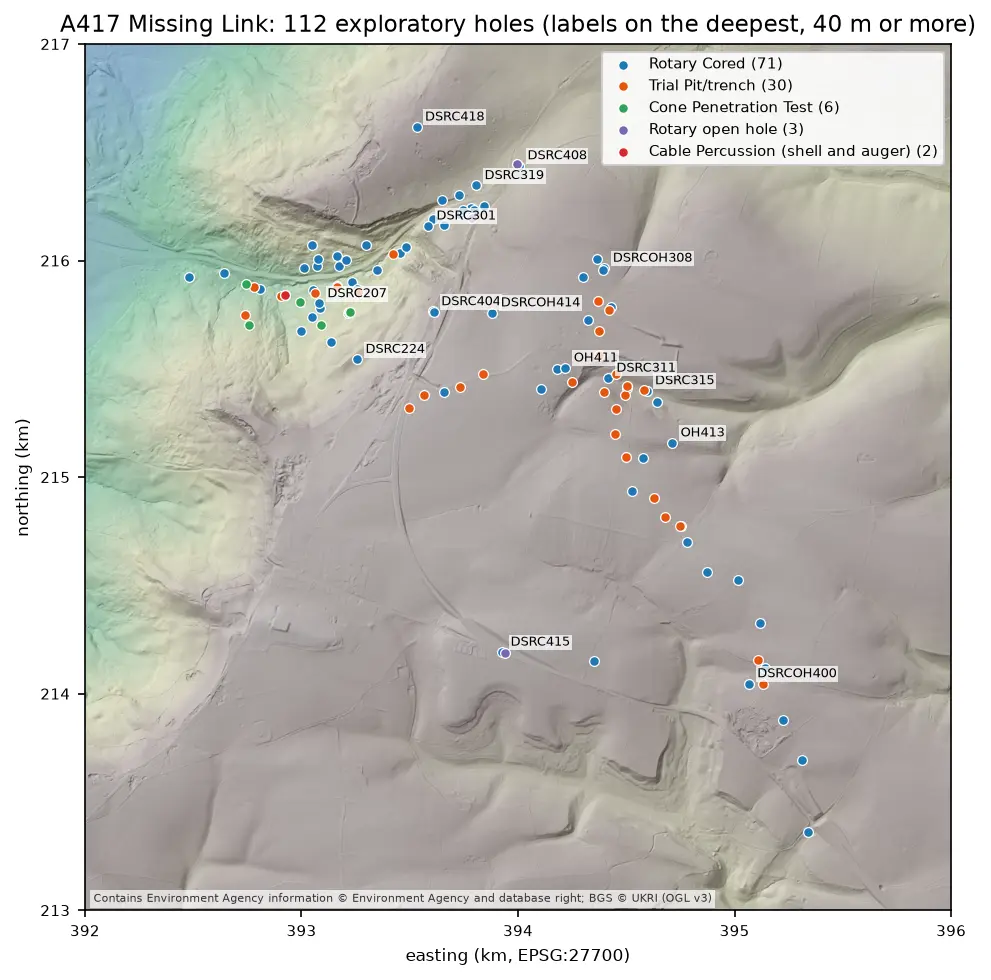
Map of the A417 Missing Link ground investigation on a grey LIDAR hillshade: 112 coloured points for rotary cored boreholes, trial pits, cone penetration tests, open holes and cable percussion boreholes, strung along the road corridor from the vale in the north-west, up the escarpment and south-east across the plateau, with the deepest holes labelled.

Tutorial Python Part 2 of 7

Boreholes on a map: AGS4 locations in British National Grid with QGIS

Turn the LOCA group of a real AGS4 file into points in British National Grid, see what happens when the CRS is wrong, summarise each hole's geology from GEOL, check every ground level against Environment Agency LIDAR, and build a QGIS project with labels and a map tip that shows the borehole log.
Intermediate 8 min read

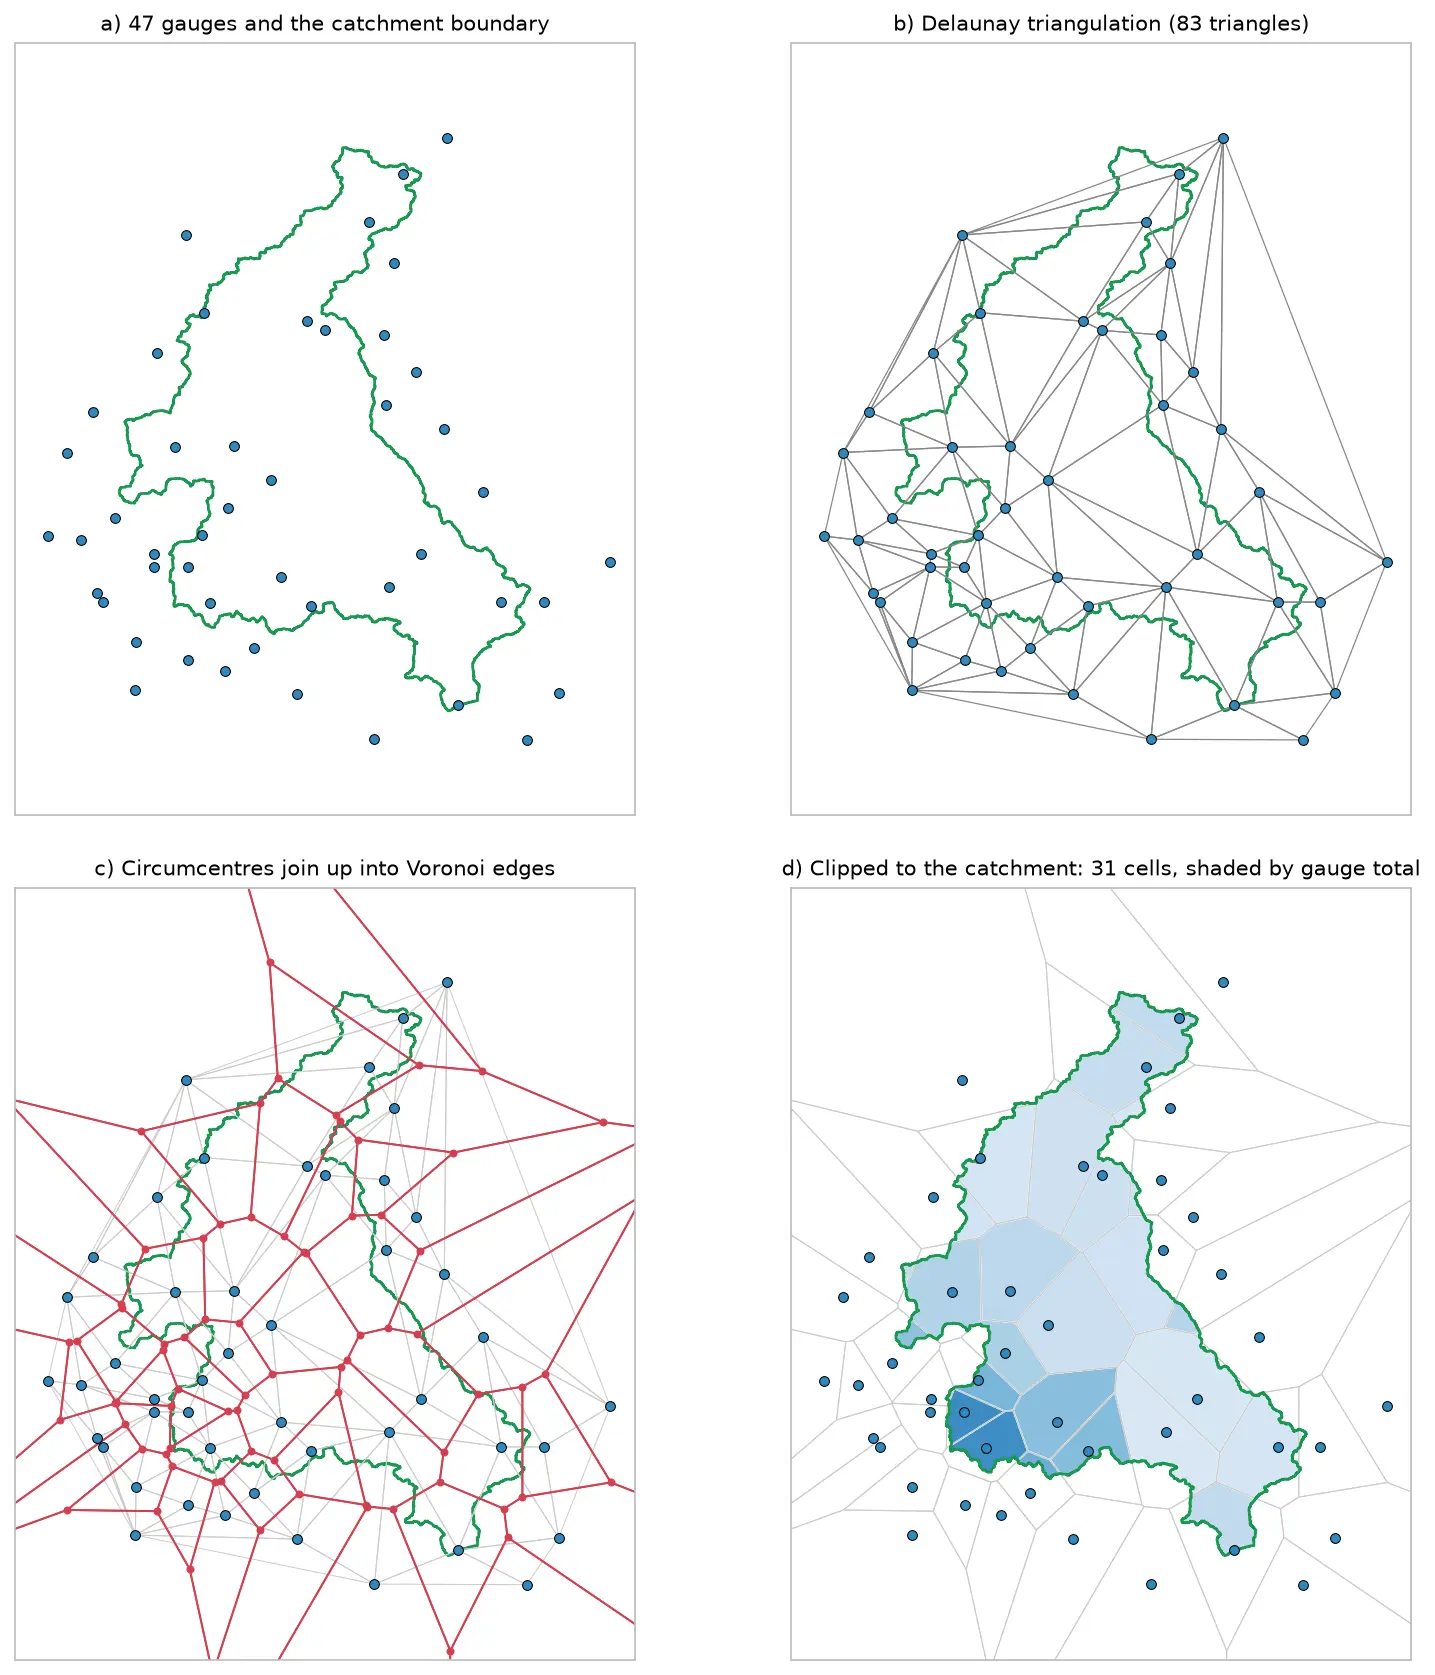
Four panels showing how Voronoi polygons are built for 47 rain gauges around the River Eden catchment: the gauges and the catchment outline, their Delaunay triangulation, the triangle circumcentres joined into red Voronoi edges, and the cells clipped to the catchment and shaded by each gauge's rainfall.

Tutorial Python

Voronoi (Thiessen) polygons in Python: catchment rainfall from EA rain gauges and fire station areas in Cumbria

Build Voronoi (Thiessen) polygons in Python with shapely and GeoPandas, clipped to a real boundary. Compute Thiessen-weighted catchment rainfall for the River Eden from Environment Agency rain gauge readings, check the gauges, compare with the gauge average and IDW, then compare Voronoi 'nearest fire station' areas in Cumbria with drive-time service areas from OpenStreetMap.

Intermediate 15 min read

Tutorial Python

Height above nearest drainage (HAND) flood mapping in Python: the River Severn

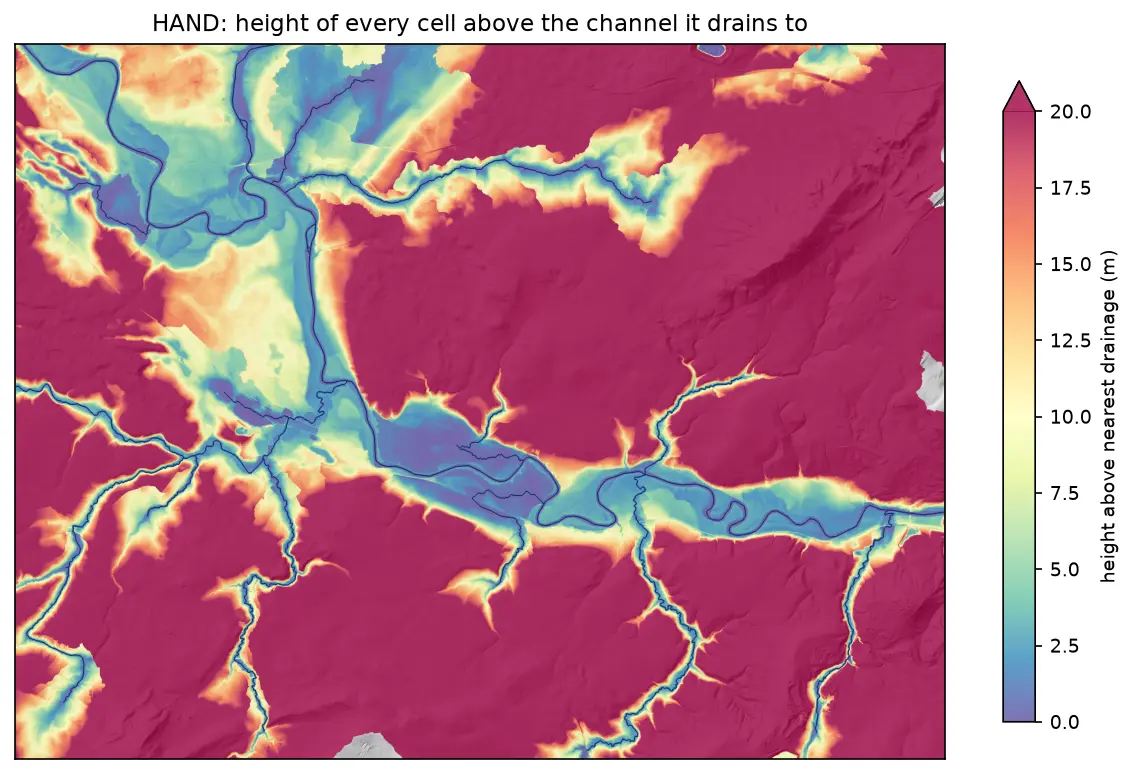
Compute height above nearest drainage (HAND) from the Environment Agency LIDAR DTM at 5 m with pysheds, turn it into inundation extents for a range of stage heights on the River Severn between Shrewsbury and Buildwas, relate them to the Buildwas gauge, and score them honestly against the Environment Agency Flood Map for Planning with the hit rate, false-alarm ratio and critical success index.

Intermediate 13 min read

Tutorial Python

Rooftop solar potential from LiDAR in Python: pvlib, PVGIS and shading for every roof

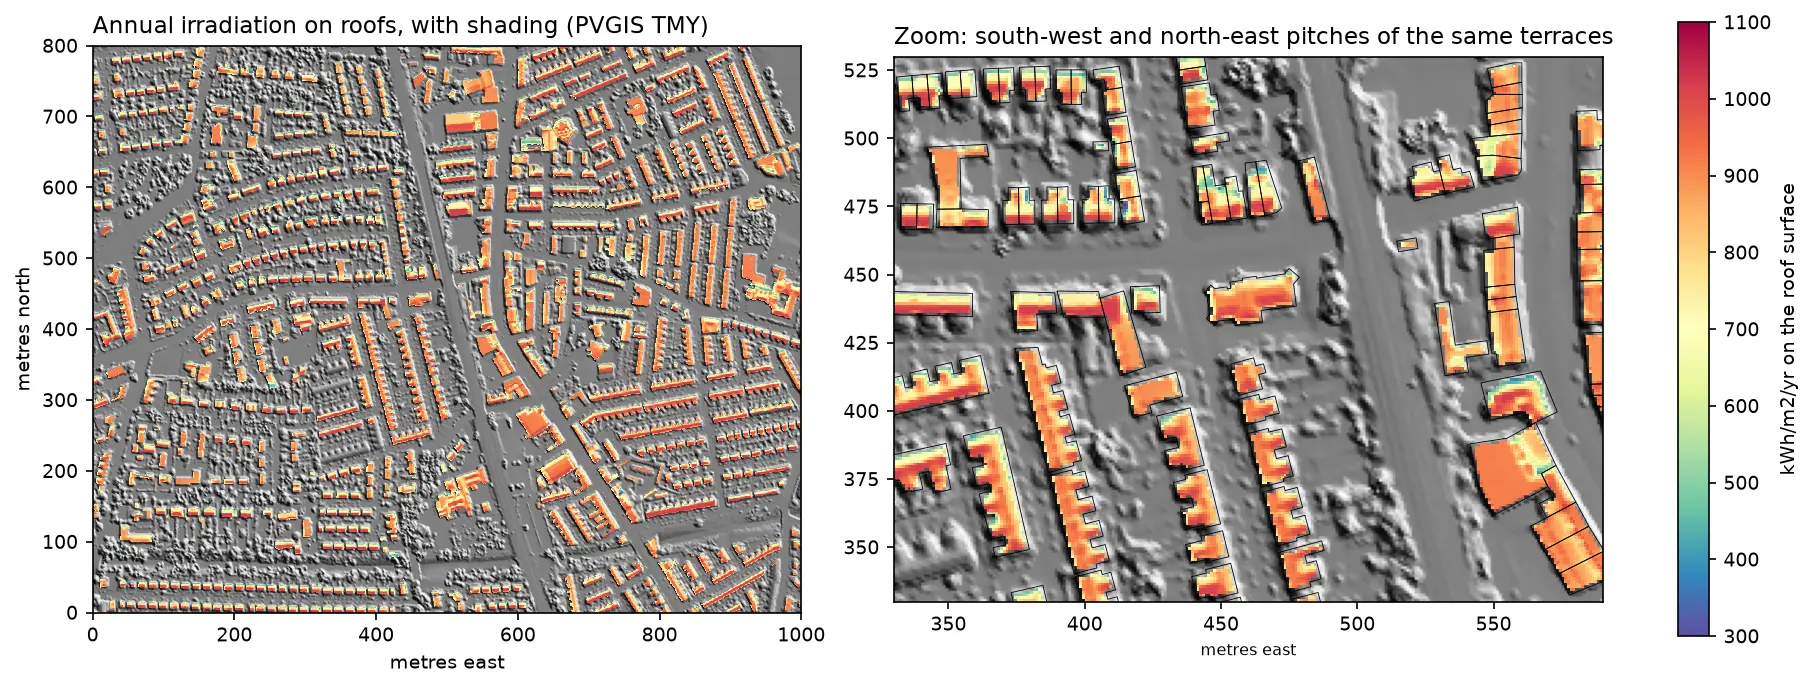
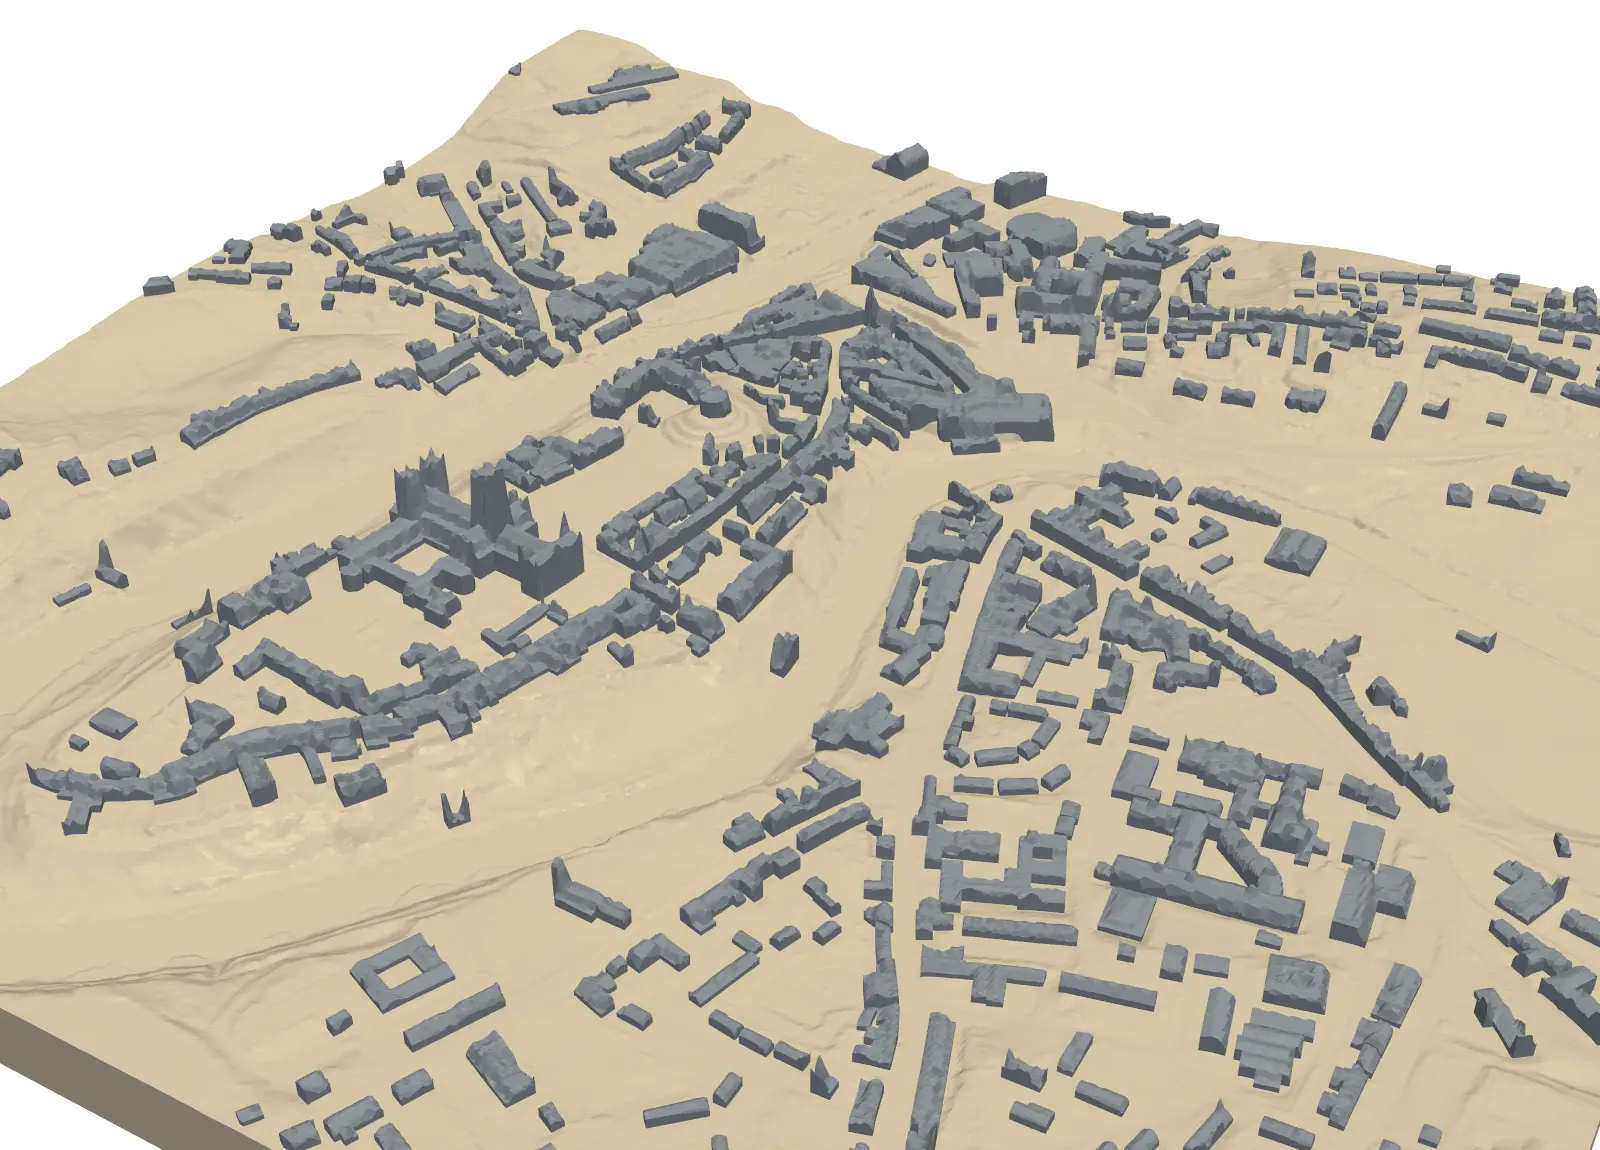
Estimate rooftop solar potential in Python for 2,148 buildings in Manchester: take a 1 m Environment Agency LiDAR DSM and Overture Maps footprints, compute roof slope and aspect, trace horizon angles for shading from neighbours and trees, build a sun map from a PVGIS typical year with pvlib, check it against pvlib's Perez model and PVGIS, then estimate kWp and kWh per year per roof and rank the best roofs.

Advanced 14 min read

Tutorial Python

Viewshed analysis in Python: line of sight and a wind farm ZTV with GDAL and numpy

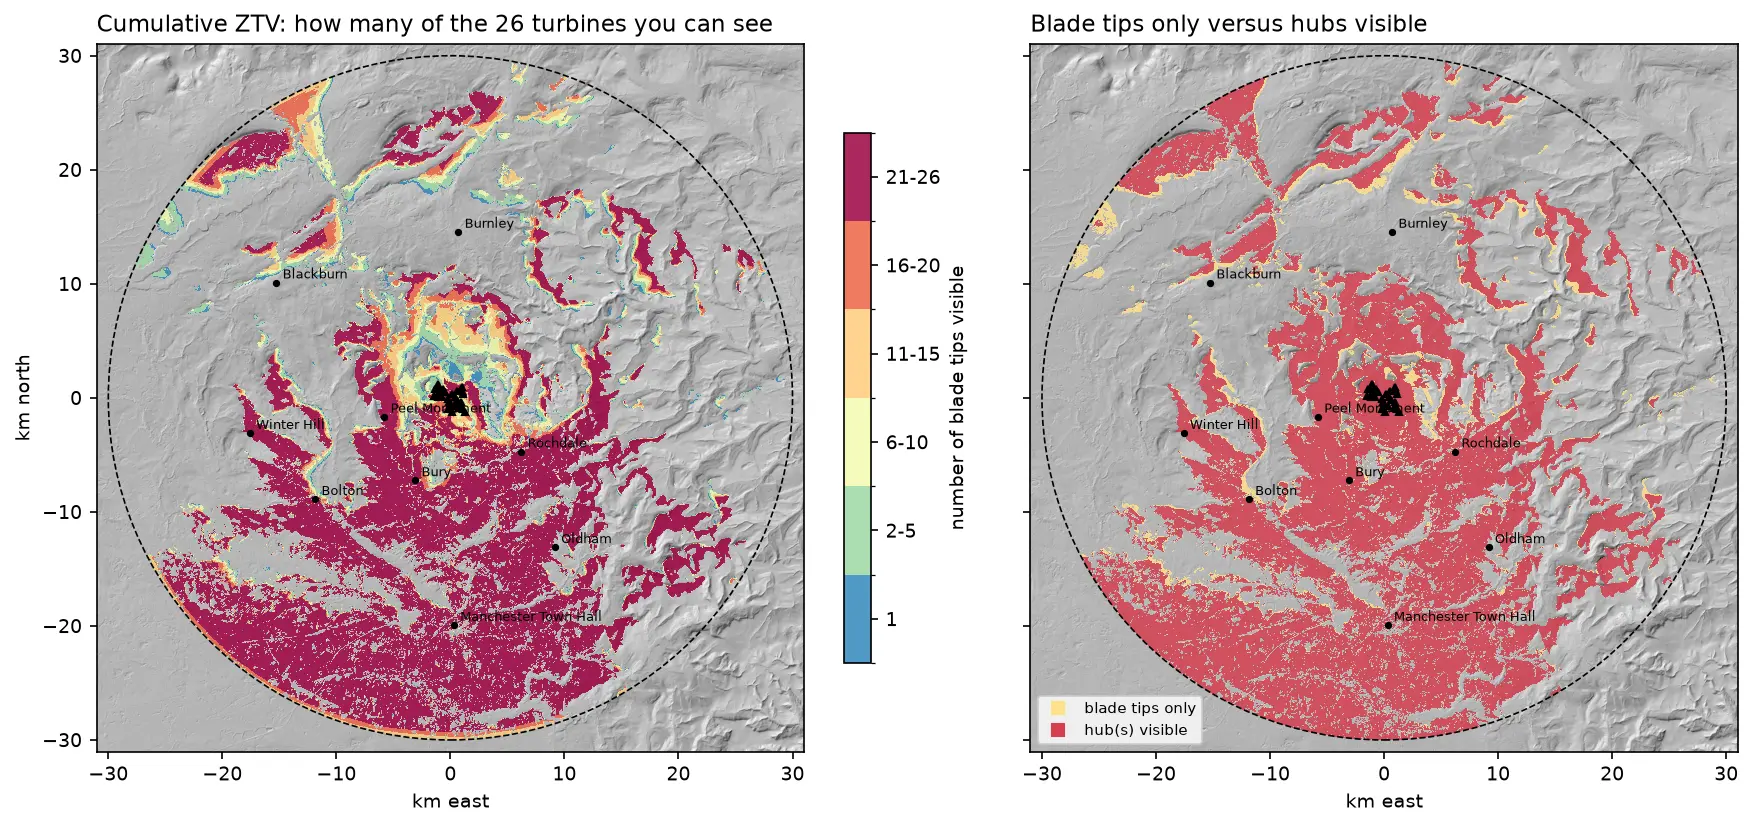
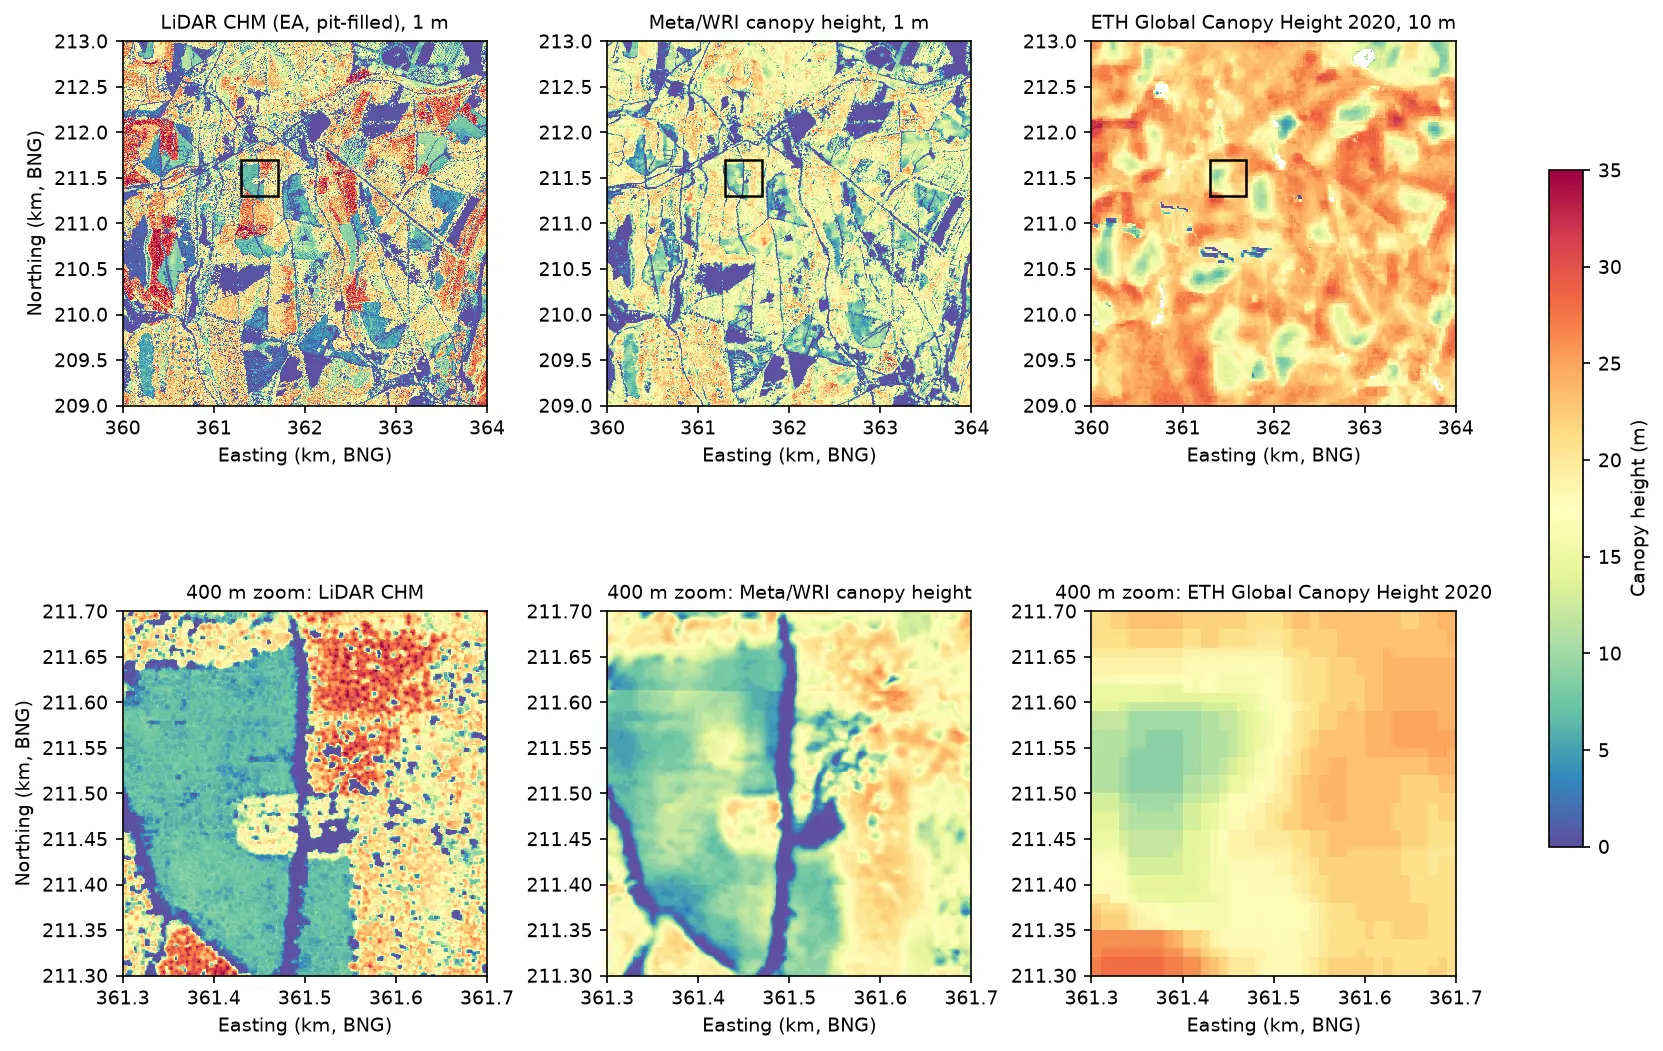
Run a viewshed analysis in Python on a real DEM: compute what one wind turbine can see with gdal.ViewshedGenerate, rebuild the same line-of-sight algorithm in numpy, correct for earth curvature and refraction, build a cumulative zone of theoretical visibility (ZTV) from 26 turbines, draw line-of-sight profiles, and measure how much trees and buildings in a LiDAR DSM shrink a bare-earth viewshed.

Intermediate 16 min read