#OpenStreetMap

13 posts

Tutorial Python

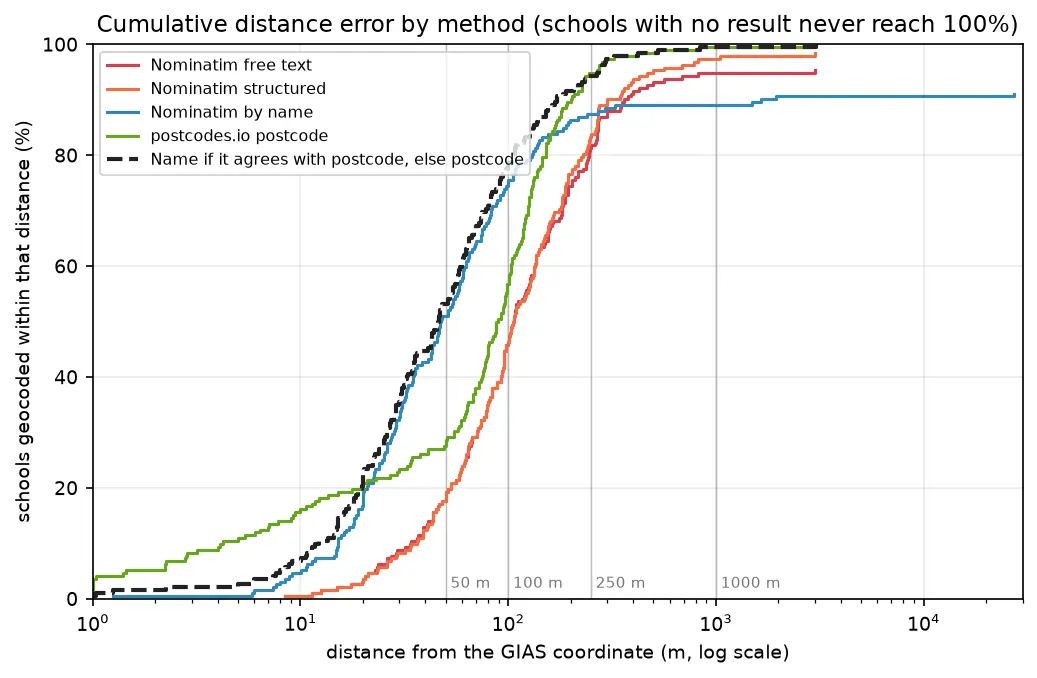
Geocoding in Python: batch and reverse geocoding with geopy, Nominatim and postcodes.io

Batch geocode all 192 open schools in Sheffield in Python with geopy and OpenStreetMap Nominatim (1 request per second, a custom user agent and an on-disk cache) and with postcodes.io bulk postcode lookups, reverse geocode a sample, and measure every method honestly against the Department for Education's own coordinates. Covers free text against structured queries, failure modes, cross-checking two geocoders, and the licensing of geocoded results.

Beginner 14 min read

Tutorial Python

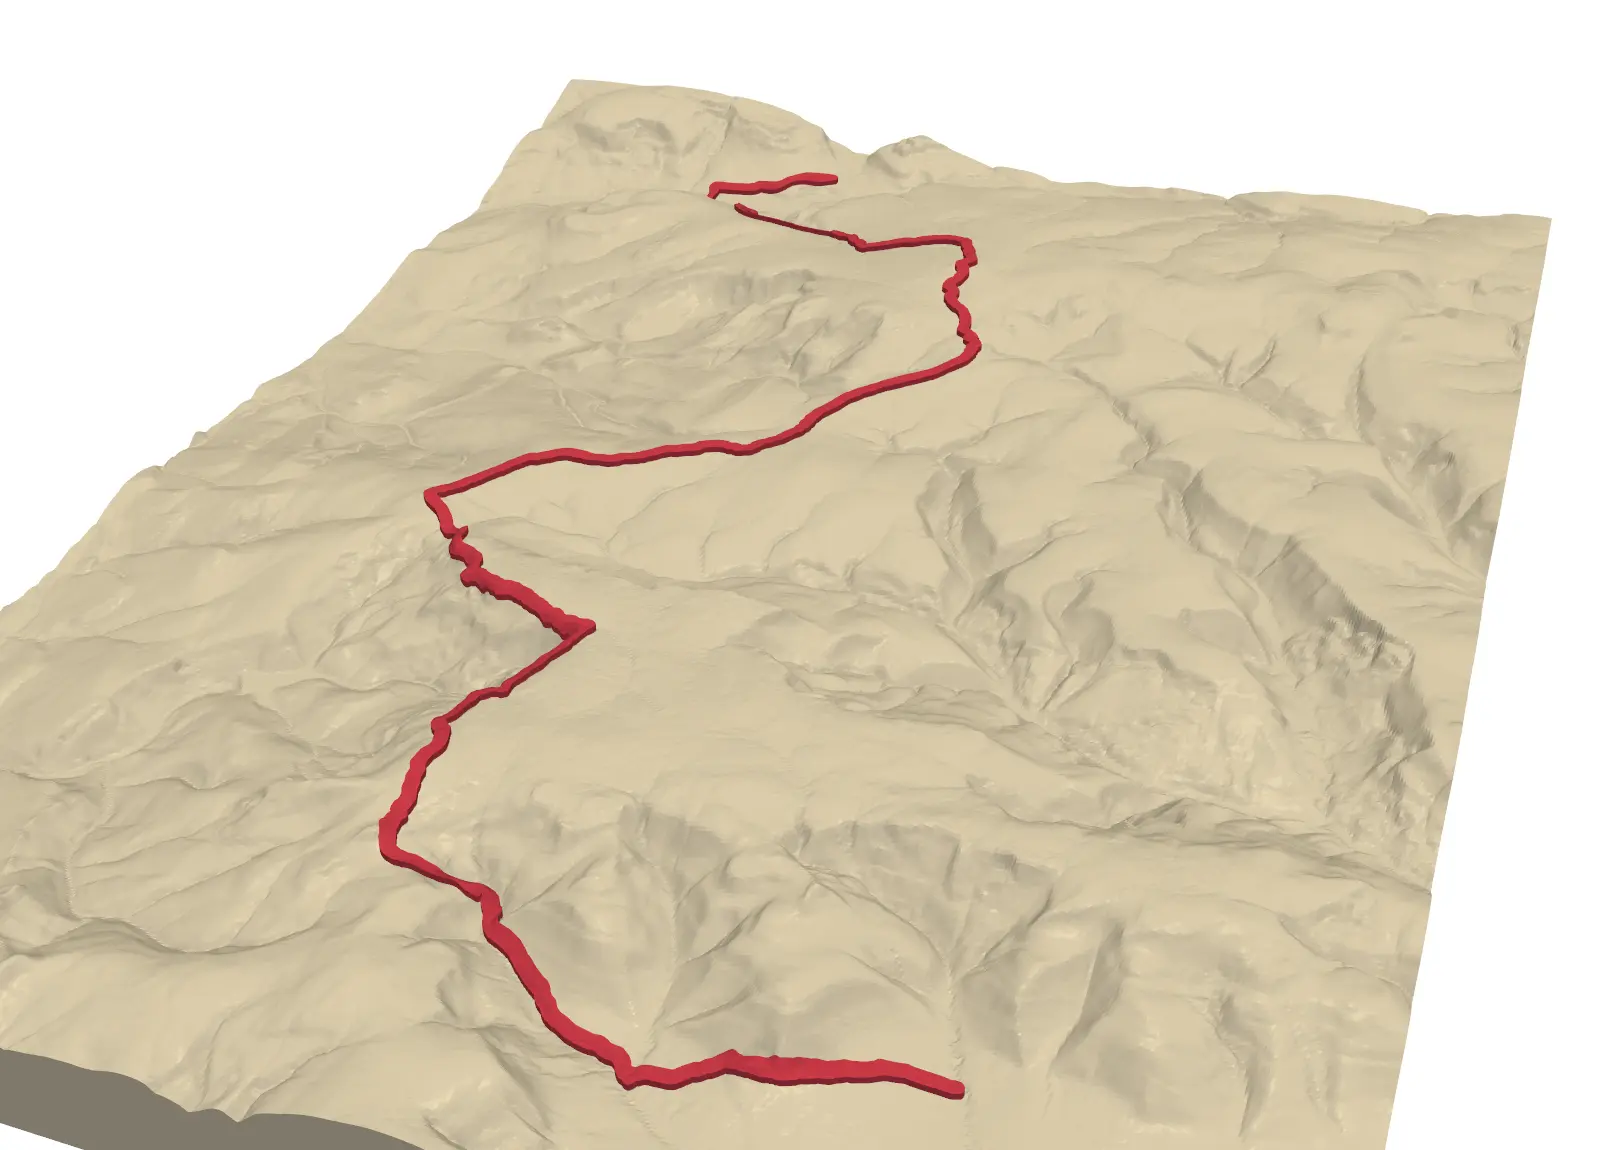
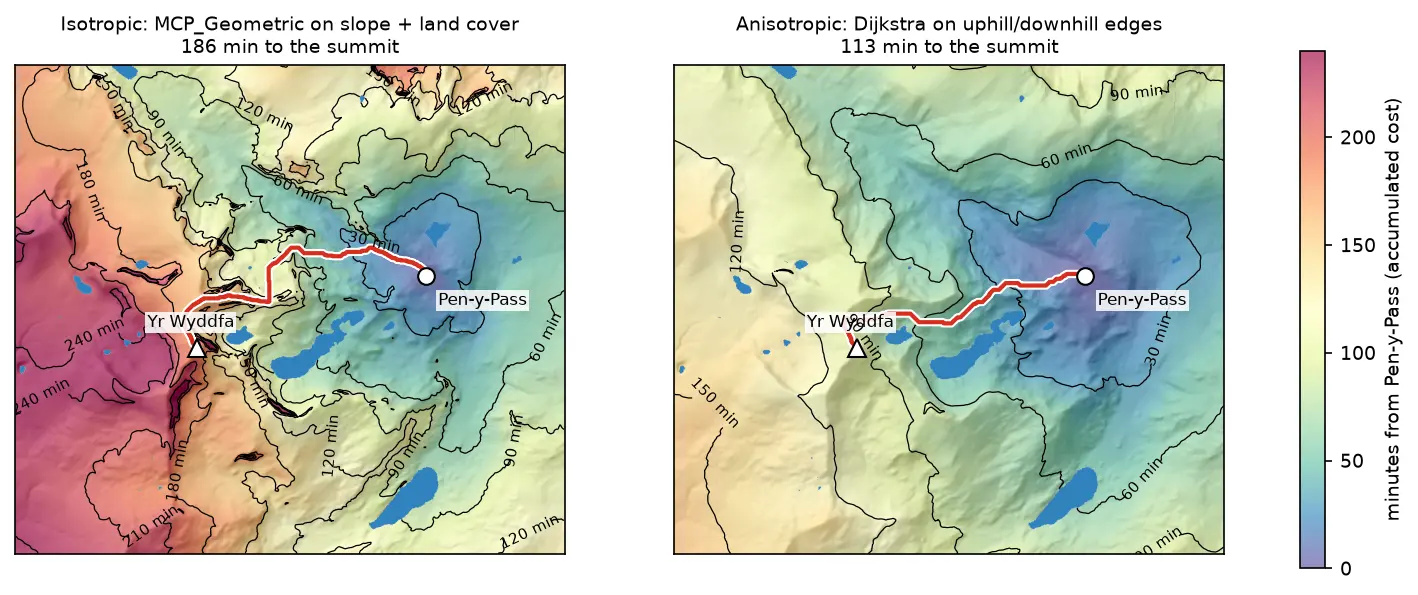
Least-cost path analysis in Python: cost surfaces and walking routes up Yr Wyddfa

Build a walking cost surface from real slope (Copernicus GLO-30) and land cover (ESA WorldCover), compute the accumulated cost surface and the least-cost path with scikit-image's MCP_Geometric, add a direction-aware Dijkstra version with SciPy, and compare the routes with the straight line and the OpenStreetMap footpaths from Pen-y-Pass to the summit of Yr Wyddfa (Snowdon).

Intermediate 14 min read

Tutorial Python Part 2 of 3

Spatial joins in GeoPandas: sjoin, predicates, sjoin_nearest and point in polygon

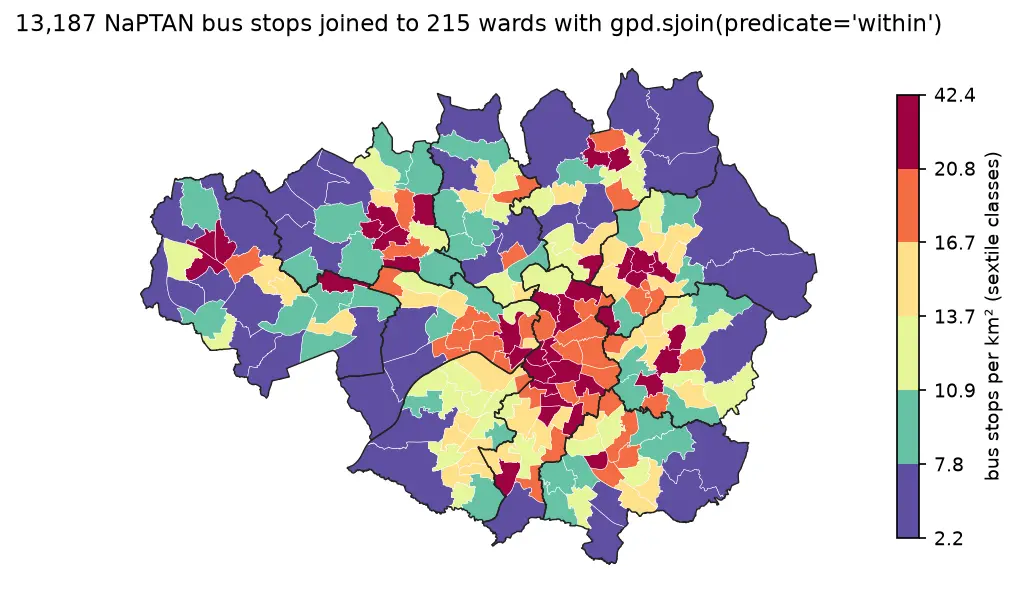
A practical guide to spatial joins in GeoPandas with real Greater Manchester data: 13,187 NaPTAN bus stops, 1,386 OpenStreetMap schools, 215 ONS wards and 1,702 LSOAs. Covers point in polygon with sjoin, predicates, counts per polygon, how='left'/'inner'/'right', sjoin_nearest with max_distance, clip and overlay, and a timing comparison of a naive loop against the spatial index.

Beginner 12 min read

Tutorial Python

Viewshed analysis in Python: line of sight and a wind farm ZTV with GDAL and numpy

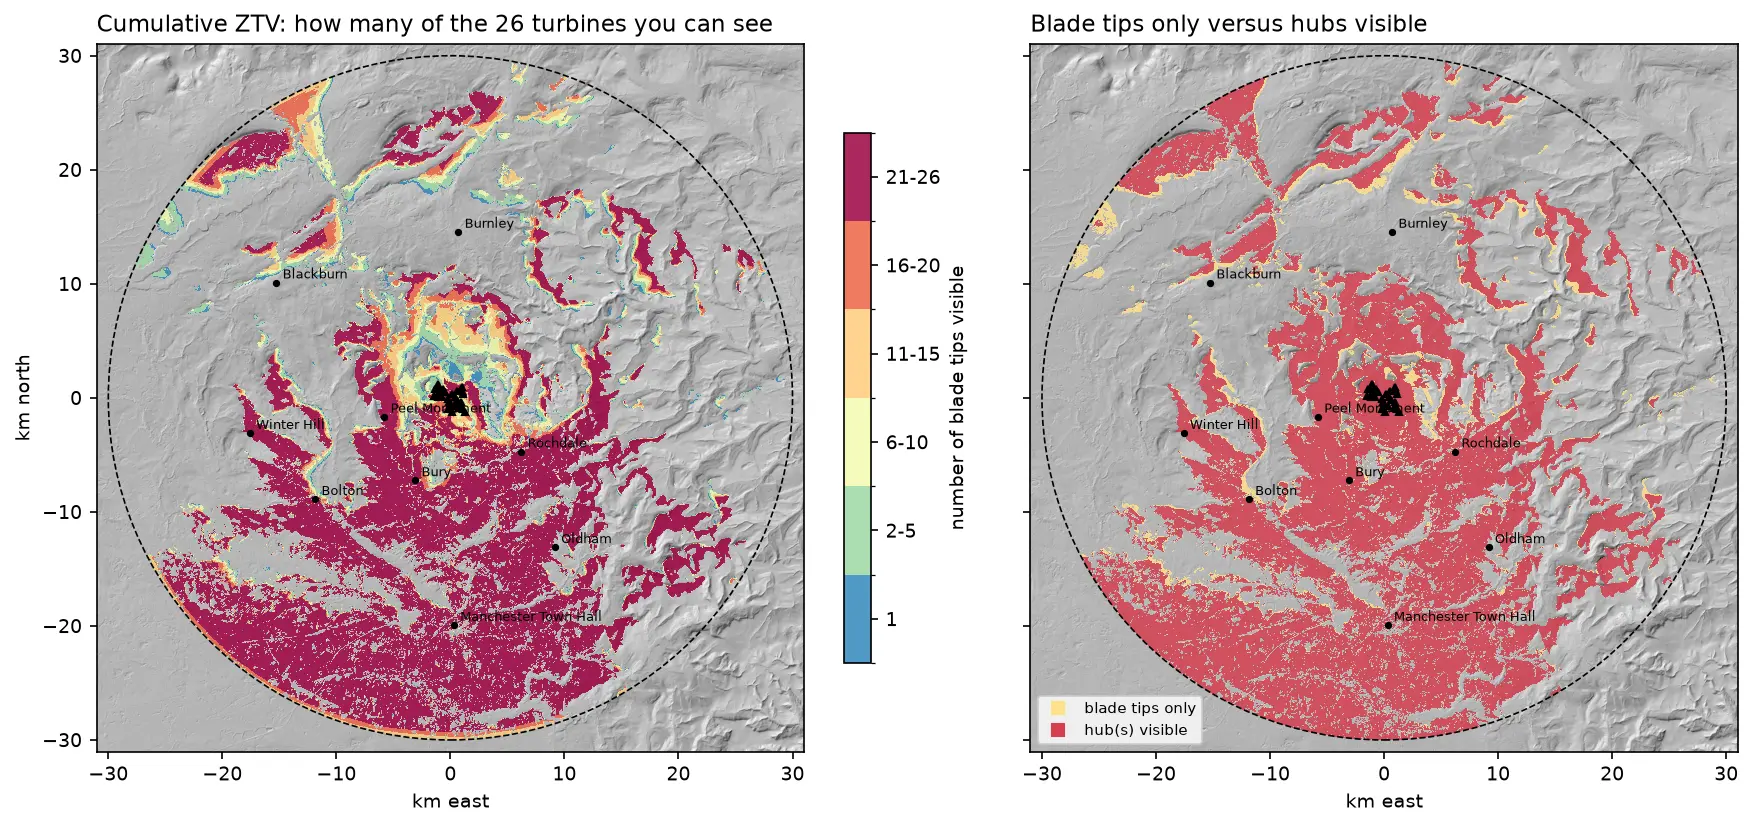
Run a viewshed analysis in Python on a real DEM: compute what one wind turbine can see with gdal.ViewshedGenerate, rebuild the same line-of-sight algorithm in numpy, correct for earth curvature and refraction, build a cumulative zone of theoretical visibility (ZTV) from 26 turbines, draw line-of-sight profiles, and measure how much trees and buildings in a LiDAR DSM shrink a bare-earth viewshed.

Intermediate 16 min read

Tutorial Python

Extract building footprints and heights from LiDAR in Python (USGS 3DEP, downtown Madison)

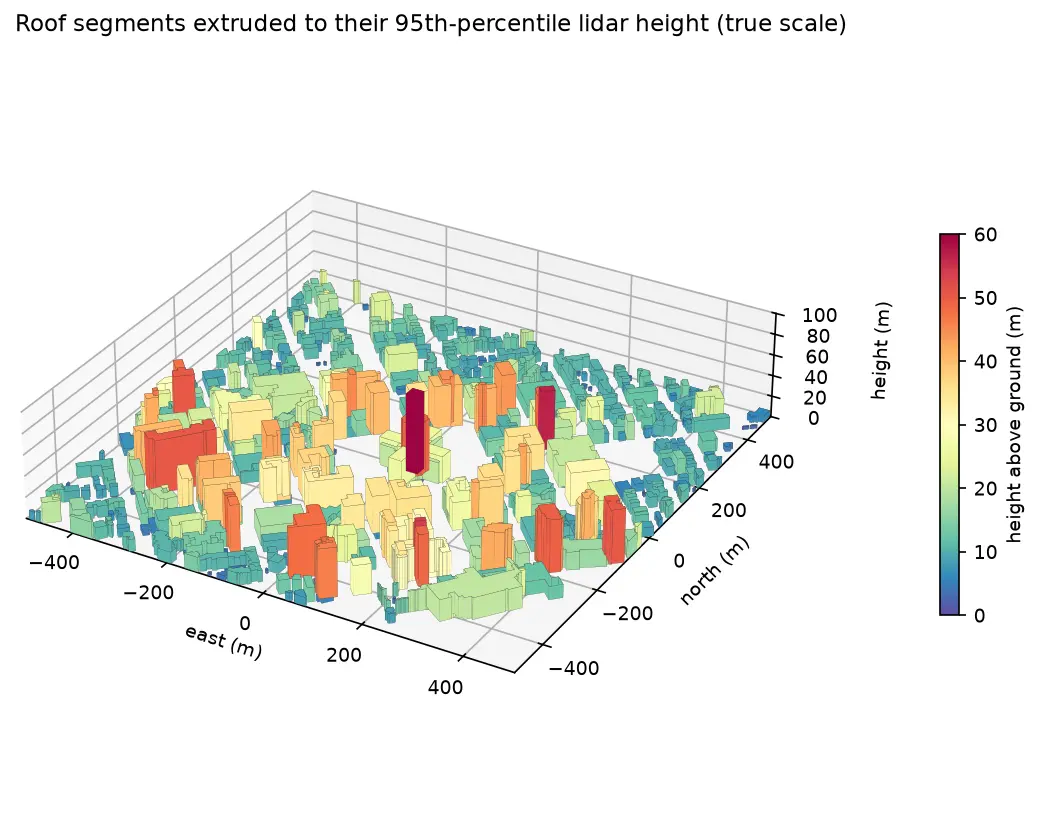
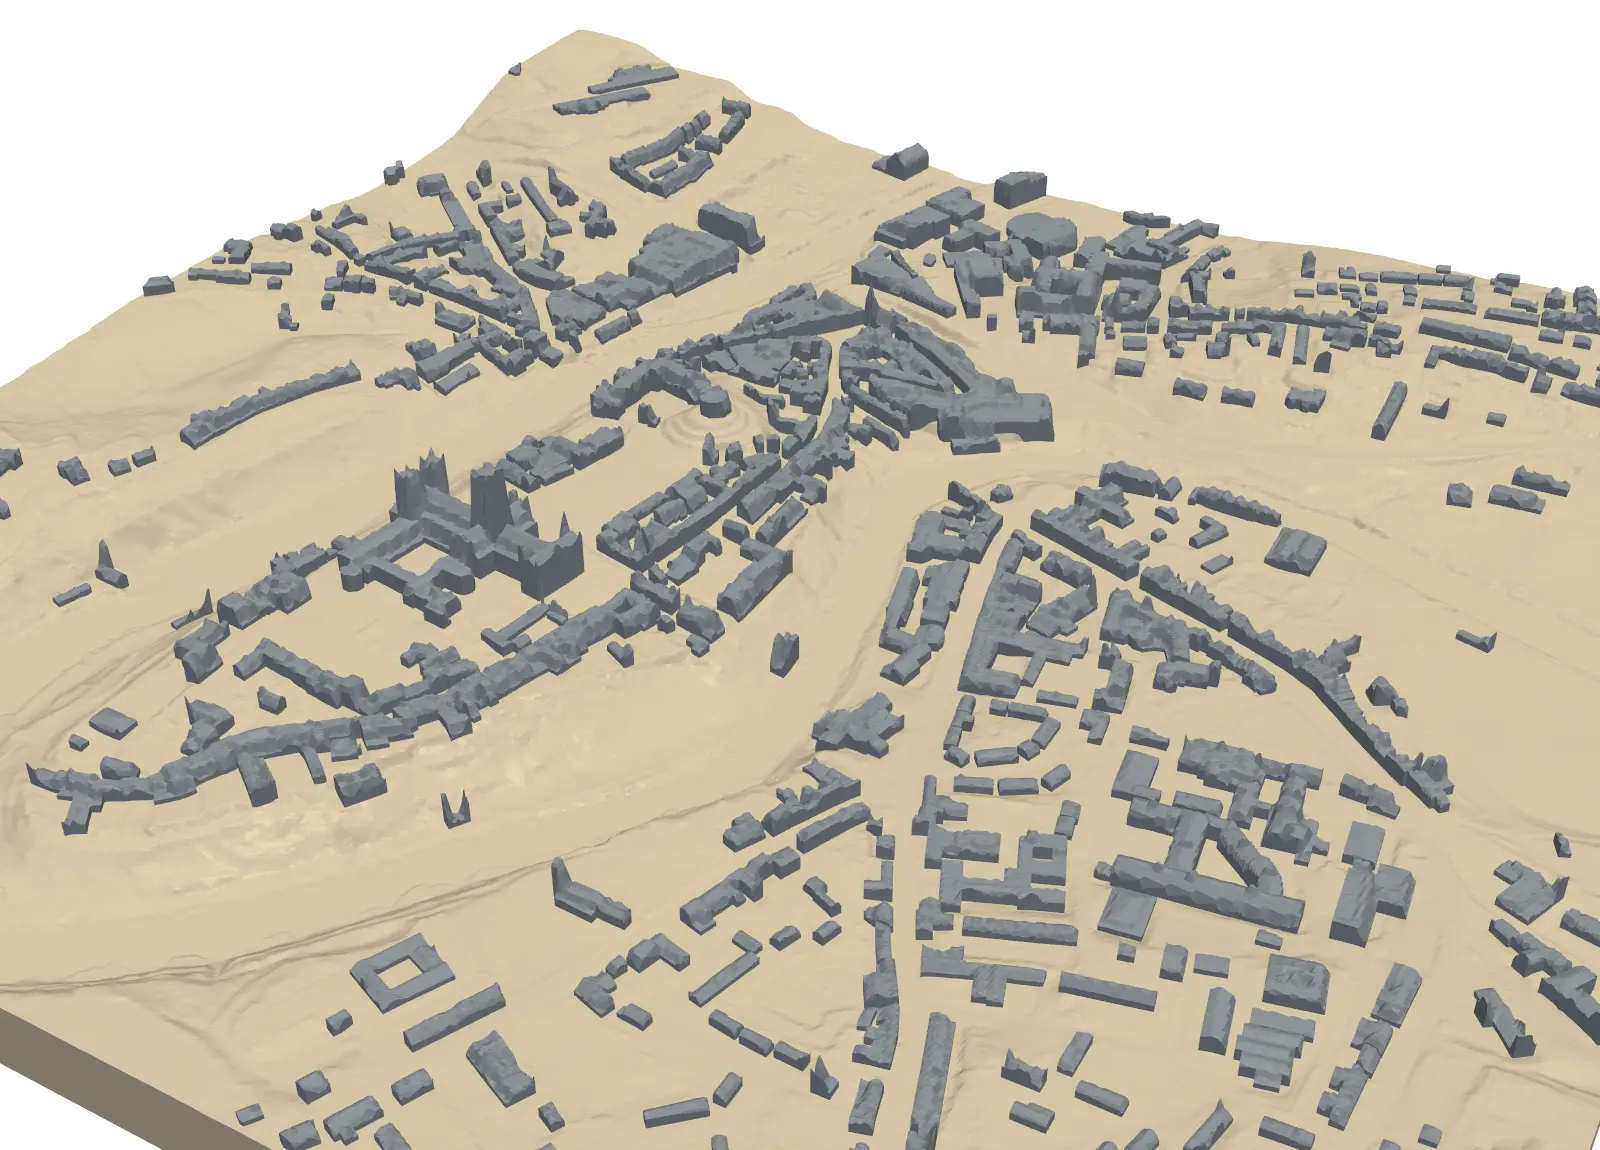
Turn classified LiDAR into building footprints with heights in Python: stream USGS 3DEP COPC tiles, build a DTM and a building nDSM from ASPRS class 6 points, polygonise and regularise the mask, split roofs at height steps, compute height statistics per building, score the result against OpenStreetMap with IoU, and export a GeoPackage and a 3D view.

Intermediate 15 min read

Tutorial Python

Segment Anything on satellite and aerial imagery in Python: a samgeo tutorial

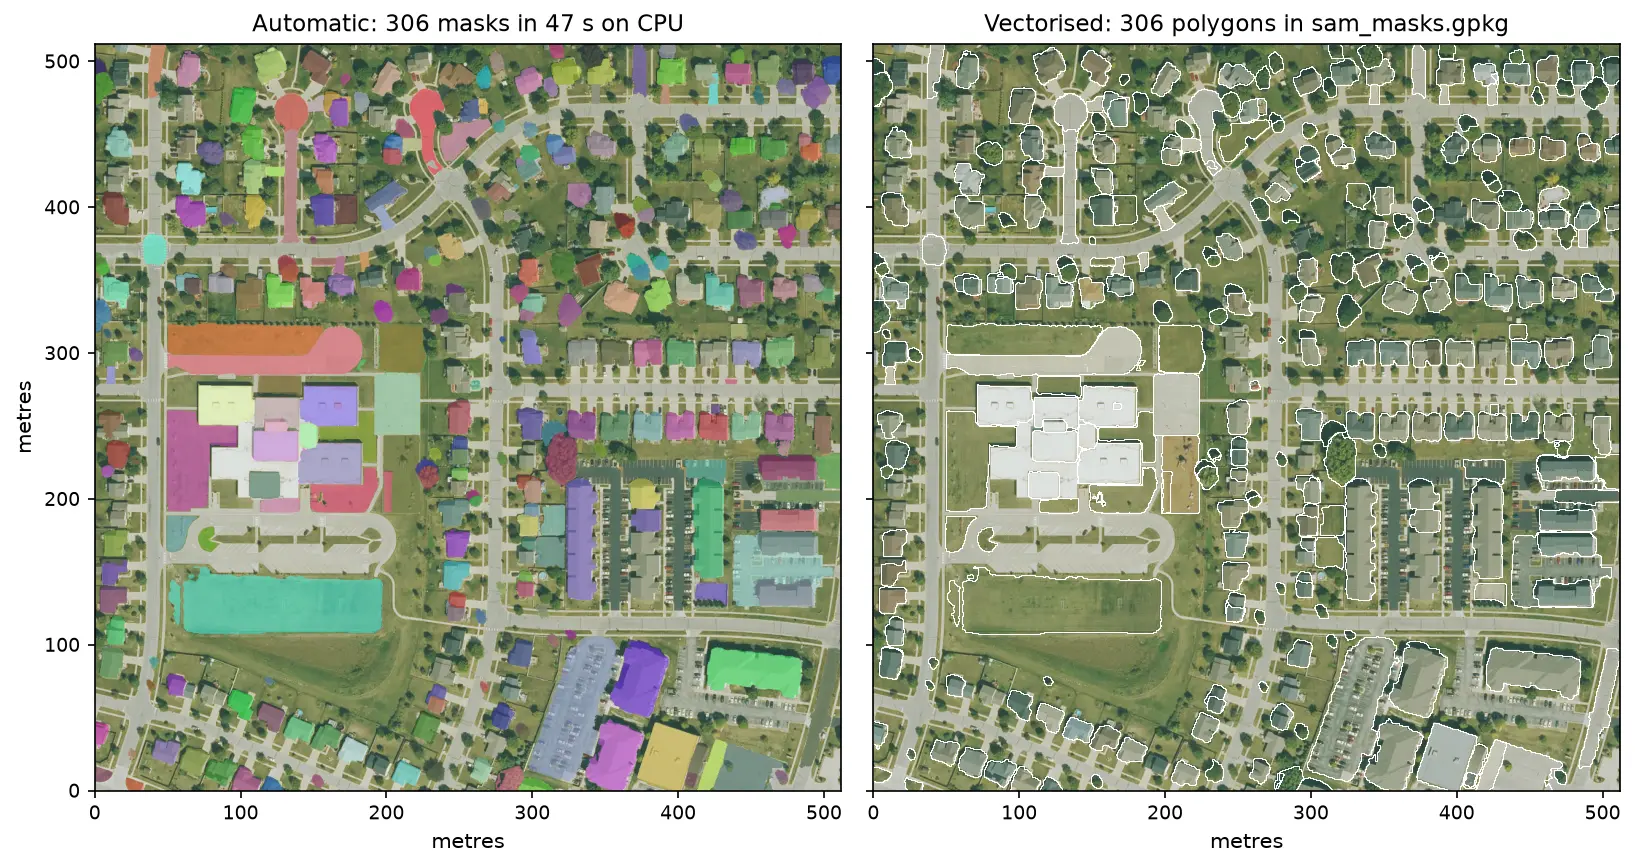
Run Meta's Segment Anything Model on high-resolution aerial imagery with segment-geospatial (samgeo), on a CPU. Generate masks automatically, vectorise them to a GeoPackage, filter them by area, shape and NDVI to find buildings, and prompt SAM with points and boxes, checked against OpenStreetMap.

Intermediate 14 min read

Tutorial Python

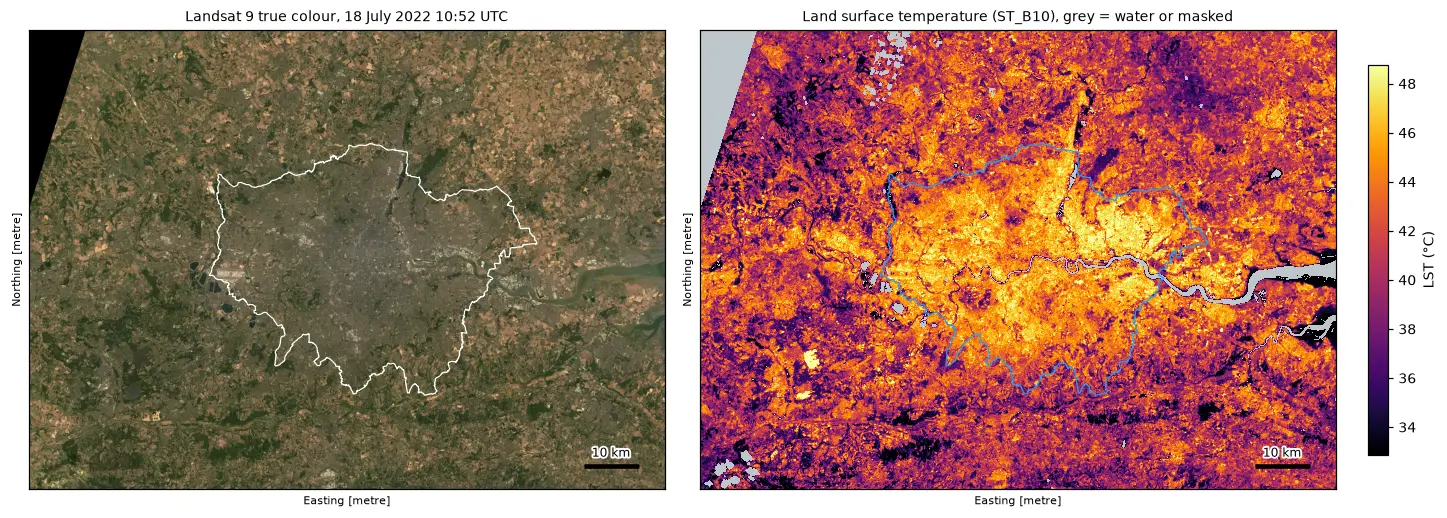
Land surface temperature from Landsat in Python: mapping London's urban heat island

Calculate land surface temperature from Landsat 8 and 9 Collection 2 Level-2 data in Python: ST_B10 scale and offset, QA_PIXEL cloud masking, LST by land cover and NDVI, an urban-rural transect, hotspots with OpenStreetMap and an honest comparison with air temperature, for London in the July 2022 heatwave.

Intermediate 17 min read

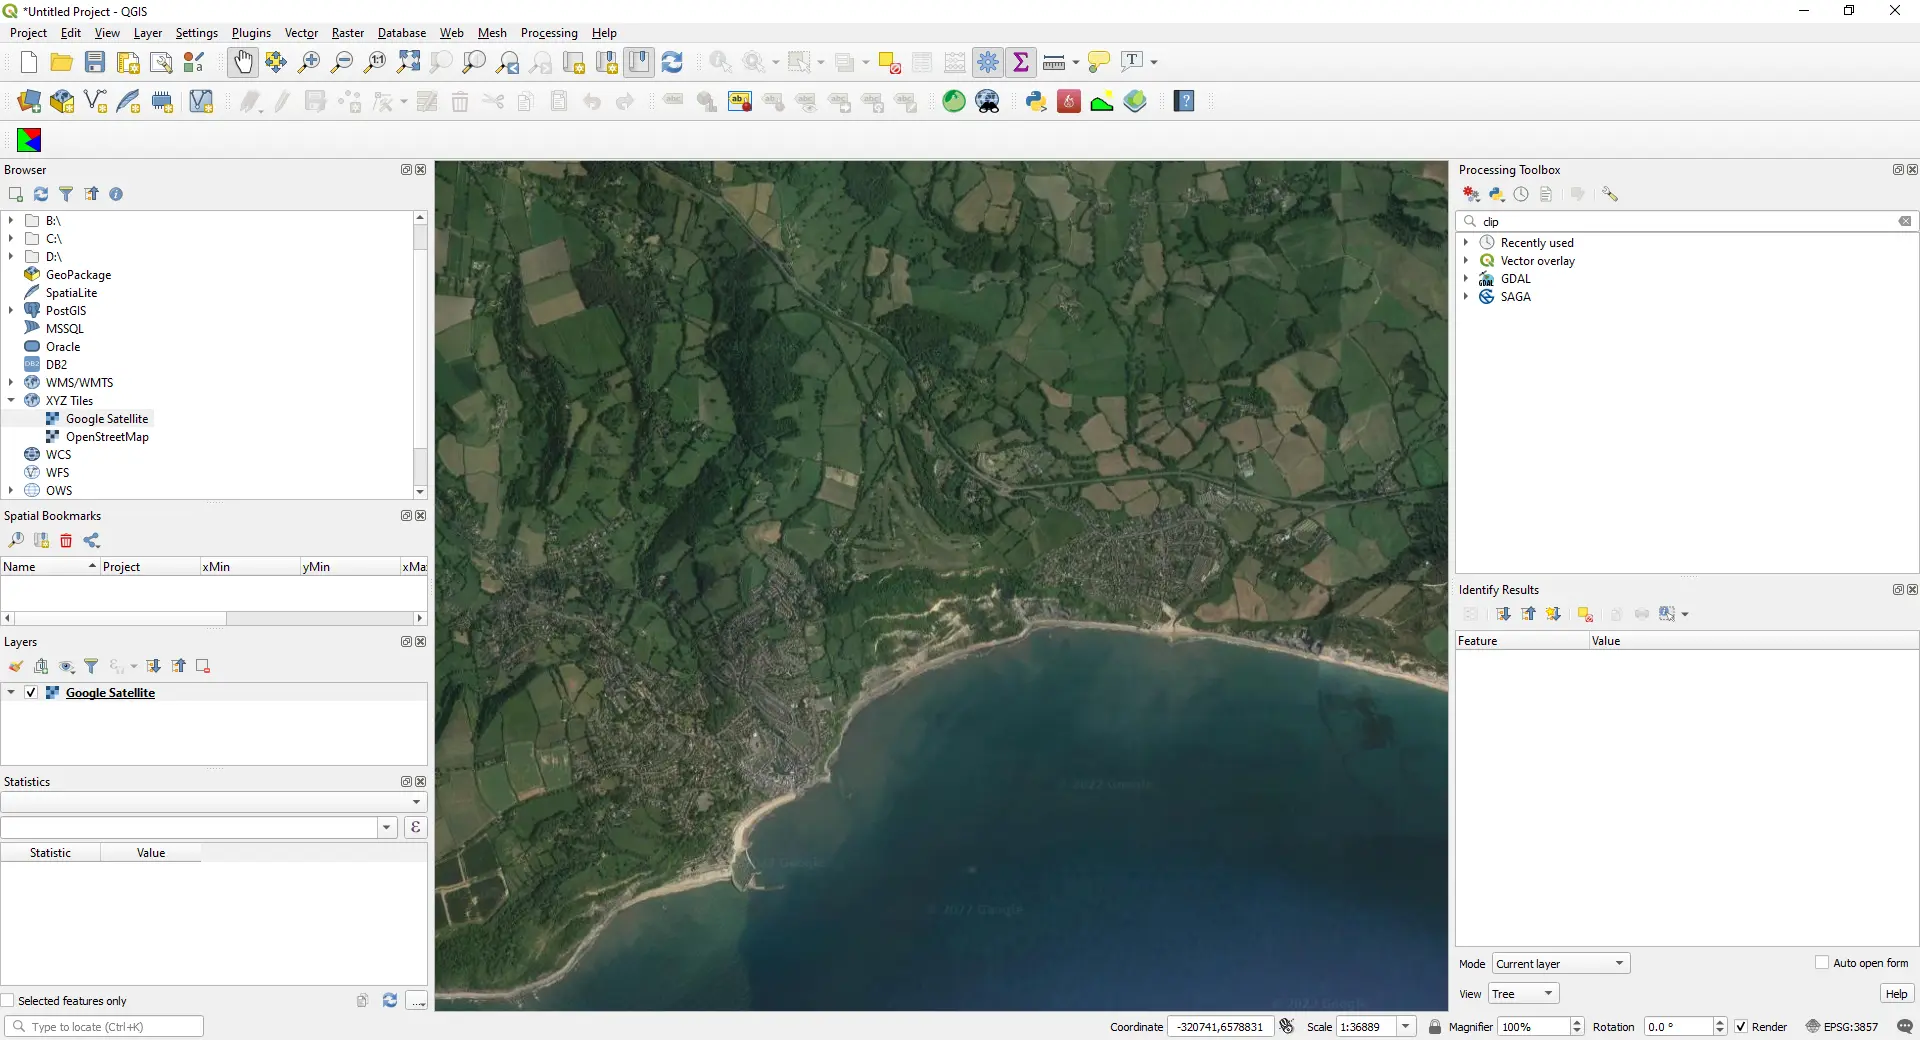
QGIS map window showing Google satellite imagery of a stretch of the south coast of England, loaded as an XYZ Tiles layer (screenshot from the original 2022 version of this post).

Article QGIS

How to Add Google Maps and OpenStreetMap Layers to QGIS

Add OpenStreetMap, satellite and Google basemaps to QGIS 3.40 LTR, 3.44 and 4.x as XYZ Tiles connections: the correct tile URLs, the OpenStreetMap tile usage policy, the licence-safe ways to get Google, Esri and Sentinel-2 imagery, and the same basemaps from PyQGIS, folium, leafmap and contextily.

Beginner 13 min read