How to Add Google Maps and OpenStreetMap Layers to QGIS
Add OpenStreetMap, satellite and Google basemaps to QGIS 3.40 LTR, 3.44 and 4.x as XYZ Tiles connections: the correct tile URLs, the OpenStreetMap tile usage policy, the licence-safe ways to get Google, Esri and Sentinel-2 imagery, and the same basemaps from PyQGIS, folium, leafmap and contextily.
Key takeaways
- QGIS already ships with an OpenStreetMap XYZ connection. If you add one yourself, use the plain tile.openstreetmap.org address with {z}/{x}/{y} placeholders. The old a. subdomain is deprecated, and the ${z} syntax now returns HTTP 400.
- The mt0/mt1.google.com URLs that circulate online, including in the 2022 version of this post, are undocumented and using them breaks the Google Maps Platform terms. The compliant route is the Map Tiles API with an API key and session token, with the Google Maps logo and data attribution shown.
- For free satellite basemaps, use Esri World Imagery under Esri's terms, or the Sentinel-2 cloudless 2016 mosaic from EOX (CC BY 4.0). Later EOX years are CC BY-NC-SA 4.0.
- The same XYZ URL works in PyQGIS, folium, leafmap and contextily, as long as you keep the attribution and follow each provider's usage policy.
Updated October 2026: this post was first published in 2022 and has been rewritten for current QGIS. The 2022 version listed Google tile URLs that you should not use and an OpenStreetMap URL that no longer works. Both are explained below. The steps were checked on QGIS 3.40.12 LTR on Windows. At the time of writing, the current long-term release is 3.44 and the latest release is 4.2; the XYZ Tiles workflow is the same in all of them.
If you searched for how to add Google Maps to QGIS, the short answer is this. QGIS loads web basemaps as XYZ Tiles connections. OpenStreetMap is already there. Google Maps can only be added legitimately through Google’s billed Map Tiles API, and for most work a free, openly licensed satellite basemap does the job without the licence risk.
Quick answer
- In the Browser panel, expand XYZ Tiles and double-click OpenStreetMap. It is installed by default.
- To add another basemap, right-click XYZ Tiles › New Connection…, give it a name, paste a URL template such as
https://tile.openstreetmap.org/{z}/{x}/{y}.png, set the maximum zoom, and click OK. - Double-click the new connection, or right-click it and choose Add Layer to Project.
- Show the provider’s attribution on anything you share or print.
What changed since 2022
| 2022 version of this post | Now | |
|---|---|---|
| OpenStreetMap URL | https://a.tile.openstreetmap.org/${z}/${x}/${y}.png |
https://tile.openstreetmap.org/{z}/{x}/{y}.png |
| Why | QGIS only substitutes {z}, {x} and {y}. The $ stays in the request, and the OSM server answers /$7/$63/$41.png with HTTP 400 Bad Request (tested 19 October 2026). The a., b. and c. subdomains are deprecated by the tile usage policy. |
|
| Google Maps | https://mt0.google.com/vt/lyrs=… URLs |
Not recommended: undocumented and outside the Google Maps Platform terms. Use the Map Tiles API or an open alternative. |
| OSM connection | Added by hand | Ships with QGIS |
OpenStreetMap is already in QGIS
Current QGIS installs ship with two XYZ connections: OpenStreetMap and Mapzen Global Terrain. They are defined in resources/qgis_global_settings.ini in the QGIS install folder. In QGIS 3.40.12 the OpenStreetMap entry is:
[connections]xyz\items\OpenStreetMap\url=https://tile.openstreetmap.org/{z}/{x}/{y}.pngxyz\items\OpenStreetMap\zmax=19xyz\items\OpenStreetMap\zmin=0A brand-new QGIS 3.40.12 profile lists exactly those two connections under XYZ Tiles. If your profile was created by an older QGIS, or you copied connections from an old blog post, check that each connection uses the URL above. If it is missing, add it as described in the next section.
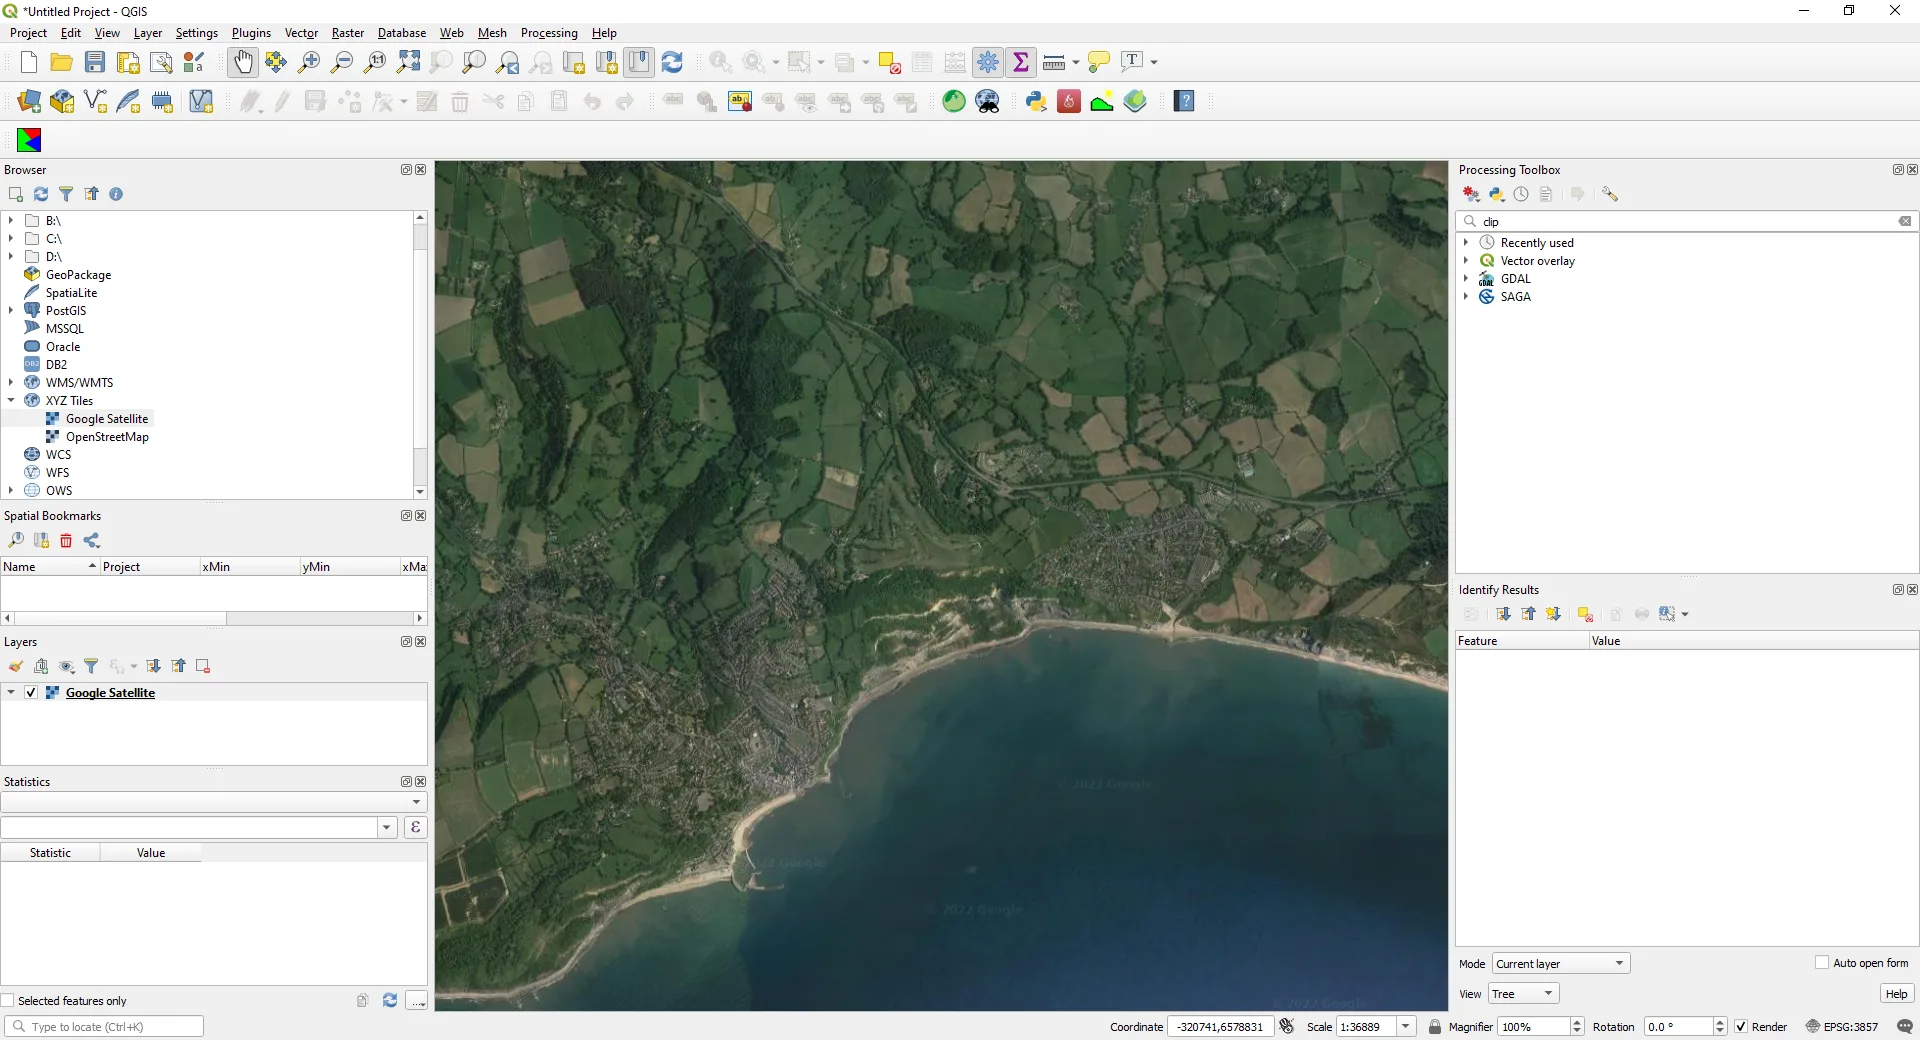
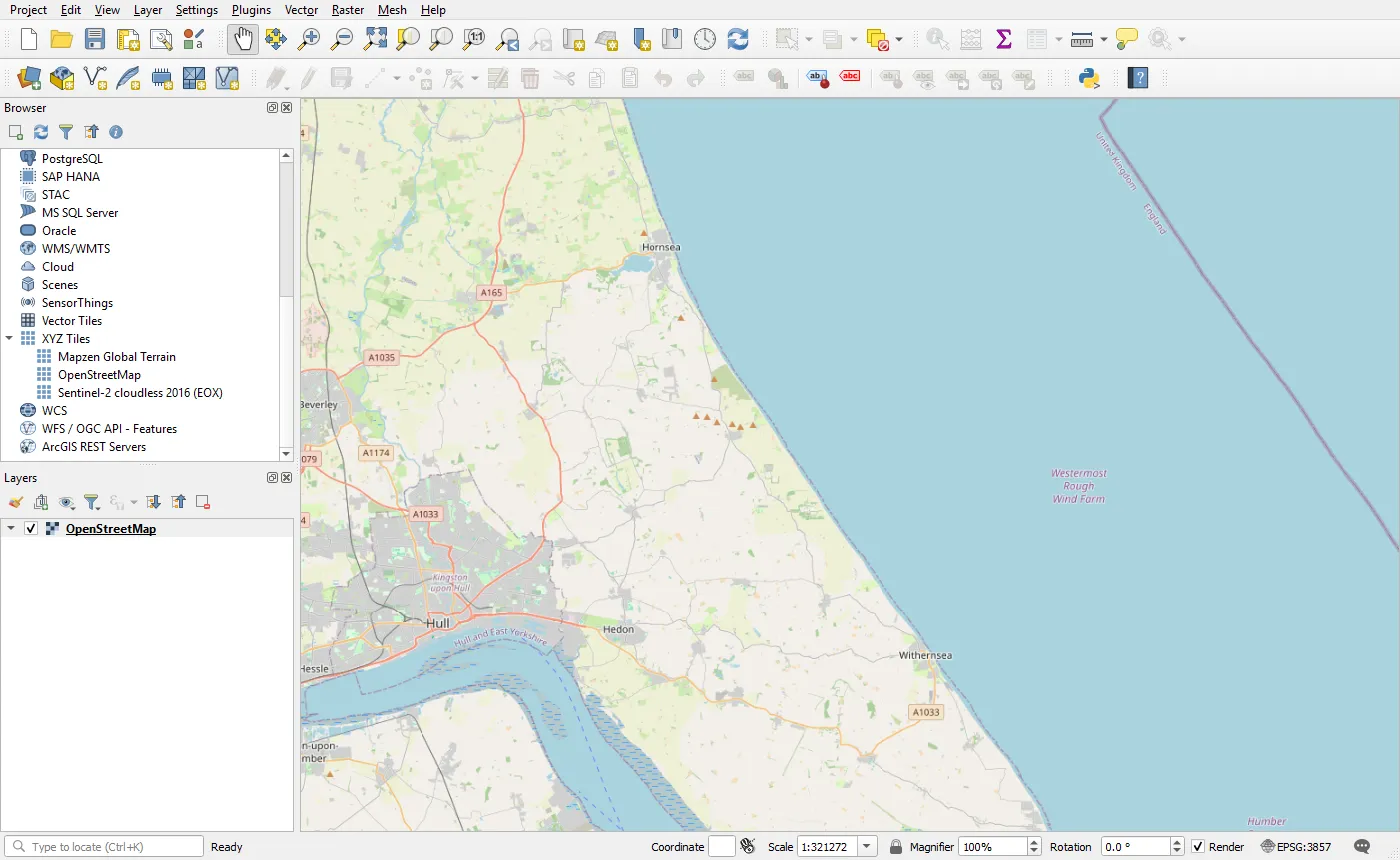 QGIS 3.40.12 with a fresh profile. The two default XYZ connections (Mapzen Global Terrain and OpenStreetMap) plus a Sentinel-2 cloudless connection added with the PyQGIS code below. The OpenStreetMap layer shows the Holderness coast in East Yorkshire, used in our coastal erosion tutorial.
Add an XYZ Tiles connection in QGIS
The OpenLayers plugin from QGIS 2 is not available for QGIS 3 or 4. Basemaps are added as XYZ Tiles connections instead.
From the Browser panel, right-click XYZ Tiles and select New Connection…. You can also use Layer › Data Source Manager › XYZ (Ctrl+L).
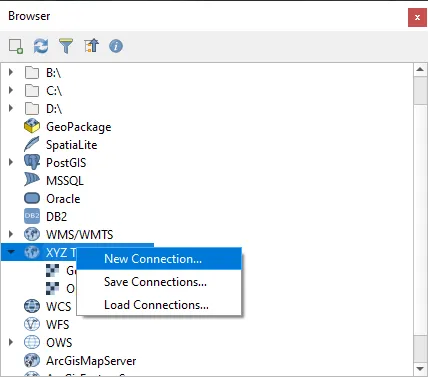 XYZ Tiles › New Connection… (screenshot from the 2022 version of this post; the menu is the same in QGIS 3.40).
In the XYZ Connection dialog:
- Name: anything you like, e.g. OpenStreetMap or Sentinel-2 cloudless 2016.
- URL: the tile URL template. QGIS replaces
{z},{x}and{y}(and{-y}for TMS-style row numbering) for each tile. Use exactly these placeholders, without a$in front. - Min. / Max. Zoom Level: 0 and the provider’s maximum, e.g. 19 for OpenStreetMap. Beyond the maximum, QGIS stretches the last level instead of requesting tiles that don’t exist.
- Authentication, Referer and HTTP headers: only needed by services that ask for them.
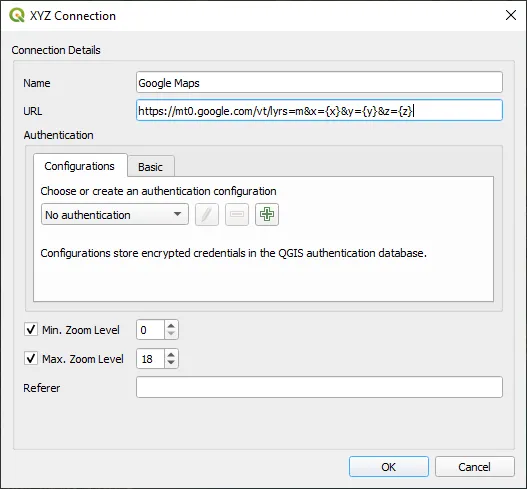 The XYZ Connection dialog as shown in the 2022 version of this post. The dialog is unchanged, but the undocumented Google URL in it should not be used. Put one of the URLs in the next section there instead.
Then right-click the new connection and choose Add Layer to Project, or double-click it.
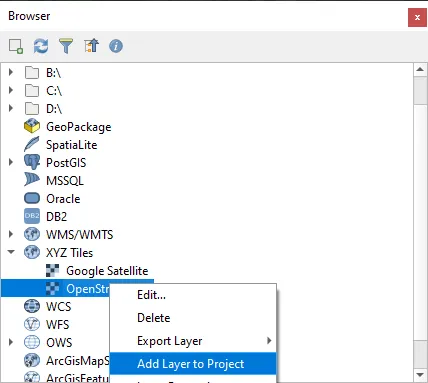 Right-click a connection and choose Add Layer to Project.
The layer appears in the Layers panel and in the map. XYZ tiles are in Web Mercator (EPSG:3857). QGIS reprojects them on the fly if your project uses another CRS, such as British National Grid (EPSG:27700), but labels look sharpest when the project CRS is EPSG:3857.
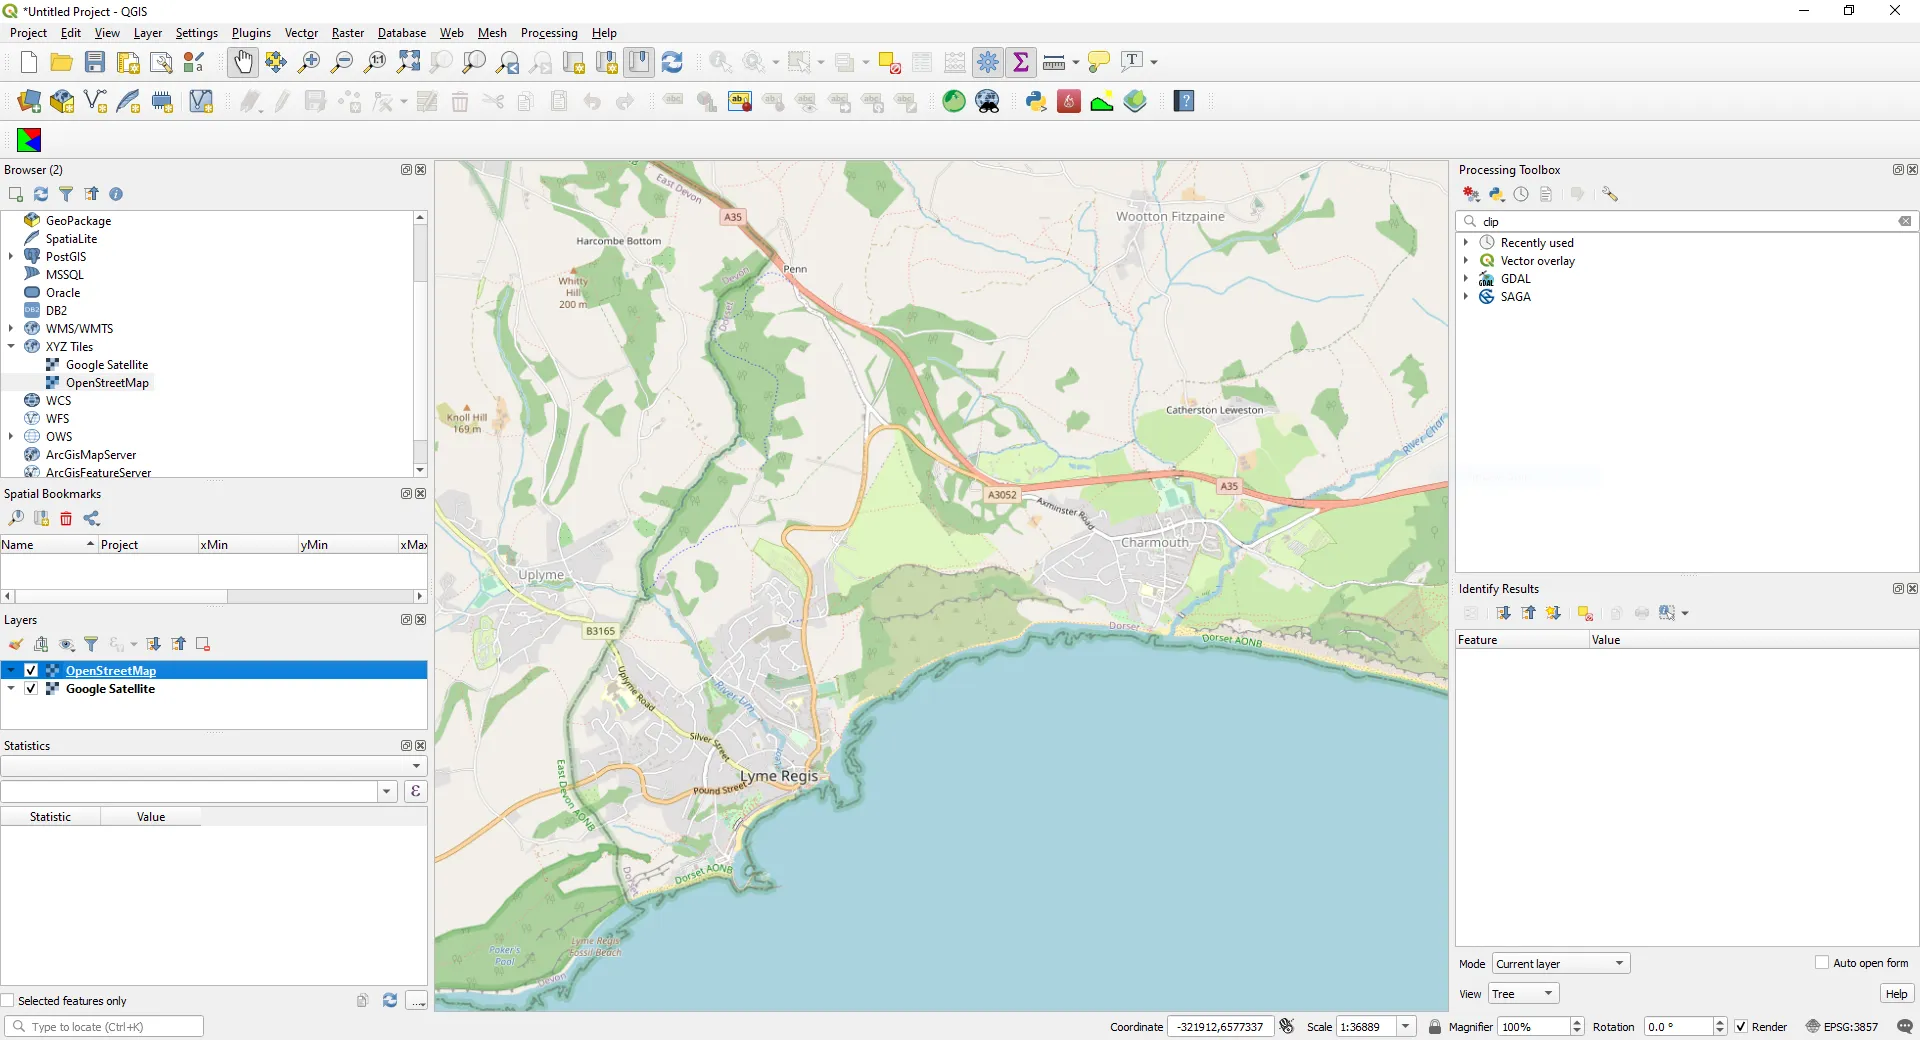 An OpenStreetMap basemap on the south coast of England.
Basemap URLs that are safe to use
These are the URLs that work in QGIS and whose terms allow this use, with the attribution each one needs. Licences and policies change, so check the linked terms before you publish.
| Basemap | XYZ URL for QGIS | Max zoom | Attribution and terms |
|---|---|---|---|
| OpenStreetMap standard | https://tile.openstreetmap.org/{z}/{x}/{y}.png |
19 | “© OpenStreetMap contributors”. Tile usage policy |
| Sentinel-2 cloudless 2016 (EOX) | https://tiles.maps.eox.at/wmts/1.0.0/s2cloudless_3857/default/g/{z}/{y}/{x}.jpg |
14 | “Sentinel-2 cloudless - https://s2maps.eu by EOX IT Services GmbH (Contains modified Copernicus Sentinel data 2016)”. CC BY 4.0 |
| Esri World Imagery | https://server.arcgisonline.com/ArcGIS/rest/services/World_Imagery/MapServer/tile/{z}/{y}/{x} |
varies by area | “Esri, Vantor, Earthstar Geographics, and the GIS User Community”. Esri terms of use |
| Google Map Tiles API | https://tile.googleapis.com/v1/2dtiles/{z}/{x}/{y}?session=SESSION_TOKEN&key=API_KEY |
22 | Google Maps logo plus the returned data attribution. Map Tiles API policies |
Note that Esri and EOX put {y} before {x}, while OpenStreetMap and Google put {x} first. The order is part of each provider’s URL; QGIS just fills in the placeholders.
The OpenStreetMap tile usage policy
The OpenStreetMap data is open (ODbL), but the tile servers at tile.openstreetmap.org are run by the OpenStreetMap Foundation, funded by donations and offered with no service-level guarantee. The tile usage policy sets the rules. The parts that matter in QGIS are:
- Use the right URL:
https://tile.openstreetmap.org/{z}/{x}/{y}.png. Noa./b./c.subdomains, nohttp://. - Show attribution: “© OpenStreetMap contributors”, visibly, on the map. QGIS does not add it to the canvas for you. Use View › Decorations › Copyright Label on screen, and a label in every print layout or exported image.
- Identify your application: send a valid User-Agent. QGIS sends its own, but scripts using a library’s default User-Agent (python-requests, for example) are blocked.
- Cache, don’t hammer: honour the HTTP caching headers. QGIS caches tiles on disk (Settings › Options › Network › Cache settings).
- No bulk downloading: don’t pre-fetch or seed tiles, and don’t use the standard tiles offline. That includes using tools or plugins to “download” an area of OSM tiles for later.
Normal interactive use in QGIS is fine. For heavy use, such as large high-DPI print exports, many users or an organisation-wide default basemap, use a commercial OSM tile provider or render your own tiles from OSM data.
Google Maps in QGIS: the honest version
The 2022 version of this post listed URLs like https://mt0.google.com/vt/lyrs=s&x={x}&y={y}&z={z} for Google Maps, Satellite, Hybrid, Terrain and Roads. They still turn up in tutorials, plugins and QGIS profiles. They load in QGIS, but you shouldn’t use them:
- They are undocumented. They are internal endpoints behind Google’s own map clients, not a Google Maps Platform API. There is no API key, no agreement, and nothing stops Google changing or blocking them.
- Using them breaks the Google Maps Platform terms. The terms cover Google Maps content obtained through the documented Google Maps Platform services. Section 3.2.3(a), “No Scraping”, forbids extracting content “for use outside the Services”, including bulk downloading tiles. Section 3.2.3(c) forbids creating content from Google Maps content, with tracing roads or building outlines from satellite imagery given as the first example.
That last point matters for GIS users in particular. Even with a paid, compliant Google connection, digitising features from Google imagery is not allowed. Google’s Map Tiles API policies also rule out image analysis, object detection, geodata extraction and offline use. Google tiles are for visualisation only.
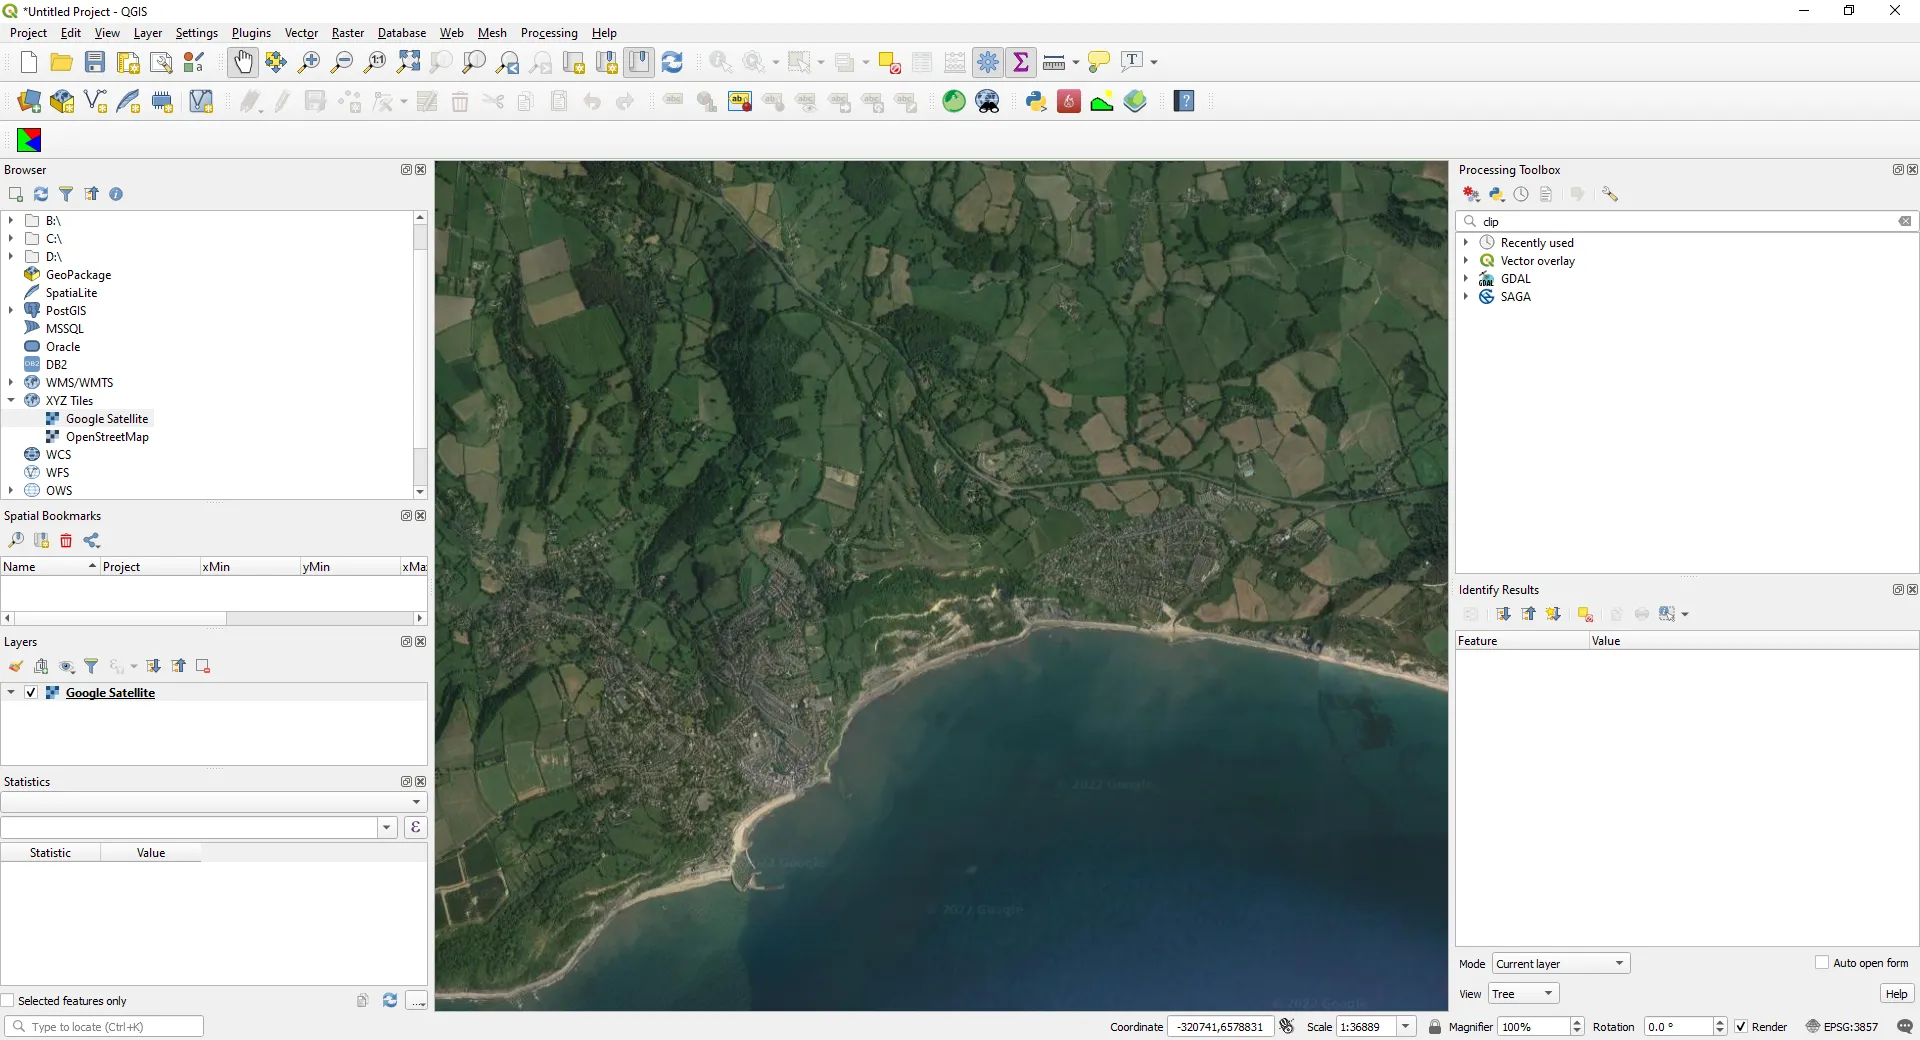 From the 2022 version of this post: Google satellite imagery loaded with an undocumented mt0.google.com URL. It works technically, but it is not a compliant way to use Google imagery.
The compliant route: Google Map Tiles API
Google’s documented way to get map tiles into third-party software is the Map Tiles API. In outline:
-
Create a Google Cloud project with billing, enable the Map Tiles API, and create an API key. Restrict the key to that API.
-
Request a session token. The token sets the map type (
roadmap,satelliteorterrain), language and region. Per Google’s documentation, it is currently valid for about two weeks; check theexpiryfield:import requestsAPI_KEY = "YOUR_API_KEY" # keep this out of shared projects and version controlr = requests.post("https://tile.googleapis.com/v1/createSession",params={"key": API_KEY},json={"mapType": "satellite", "language": "en-GB", "region": "GB"},timeout=30,)r.raise_for_status()print(r.json()["session"], r.json()["expiry"]) -
Add an XYZ connection in QGIS with the URL
https://tile.googleapis.com/v1/2dtiles/{z}/{x}/{y}?session=SESSION_TOKEN&key=API_KEYand a maximum zoom of 22. -
Meet the display requirements. Show the Google Maps logo (or the text “Google Maps” where space is short) and the data attribution string returned by the API’s viewport-information request. QGIS will not do this for you, so add them as decorations and in every layout.
-
Renew the session token when it expires, and expect billing per tile request beyond any free allowance on the pricing page.
We haven’t tested this with a live key for this post. The steps follow Google’s documentation as of October 2026. Customers with a billing address in the European Economic Area have separate terms and may see different functionality. Keep in mind that the API key is stored in plain text in your QGIS settings and in any project that uses the layer, so don’t share such projects.
Alternatives to Google satellite imagery
For a satellite backdrop in QGIS, these are usually better choices than Google:
- Esri World Imagery: high-resolution imagery for much of the world. Esri publishes it under the Esri Master License Agreement with the attribution “Esri, Vantor, Earthstar Geographics, and the GIS User Community”. Its item page says the layer is not intended for exporting tiles for offline use. Read Esri’s terms before using it commercially: commercial or application use may require an ArcGIS account or ArcGIS Location Platform access.
- Sentinel-2 cloudless by EOX: a cloud-free, 10 m global mosaic from Copernicus Sentinel-2. The 2016 mosaic is licensed CC BY 4.0, so it can be used commercially with attribution. Later years (2018 onwards, e.g. the
s2cloudless-2024_3857layer) are CC BY-NC-SA 4.0: non-commercial only, and derivatives must be shared alike. Check the licence on cloudless.eox.at for the year you use. At 10 m it won’t show individual buildings, but it is honest, open imagery. - Your own imagery: if you need to digitise from imagery, use data whose licence allows it, such as national aerial photography released under an open licence, or Sentinel-2 scenes you download yourself. Our Sentinel-2 STAC tutorial shows how.
- NextGIS QuickMapServices plugin: install it from Plugins › Manage and Install Plugins…. Version 1.5.2 of NextGIS QuickMapServices supports QGIS 3.32 to 4.x. It adds a Web › QuickMapServices menu and a searchable catalogue of basemaps. It’s a convenient catalogue, but it doesn’t change any service’s terms. If it offers Google layers, they use the same kind of undocumented endpoints, so the advice above still applies.
Add XYZ connections and layers with PyQGIS
To set up the same basemaps on several machines, or in a script, use PyQGIS. Run the following in the QGIS Python Console (Plugins › Python Console). In QGIS 3.40, XYZ connections are stored in the settings under connections/xyz/items/<name>/:
from qgis.core import QgsDataSourceUri, QgsSettingsfrom qgis.utils import iface

def add_xyz_connection(name, url, zmin=0, zmax=19):    """Add (or overwrite) a connection under Browser > XYZ Tiles."""    settings = QgsSettings()    base = f"connections/xyz/items/{name}"    settings.setValue(f"{base}/url", url)    settings.setValue(f"{base}/zmin", zmin)    settings.setValue(f"{base}/zmax", zmax)    iface.reloadConnections()

def add_xyz_layer(name, url, zmin=0, zmax=19):    """Add an XYZ layer straight to the current project."""    uri = QgsDataSourceUri()    uri.setParam("type", "xyz")    uri.setParam("url", url)    uri.setParam("zmin", str(zmin))    uri.setParam("zmax", str(zmax))    return iface.addRasterLayer(bytes(uri.encodedUri()).decode(), name, "wms")

add_xyz_connection(    "Sentinel-2 cloudless 2016 (EOX)",    "https://tiles.maps.eox.at/wmts/1.0.0/s2cloudless_3857/default/g/{z}/{y}/{x}.jpg",    zmax=14,)add_xyz_layer("OpenStreetMap", "https://tile.openstreetmap.org/{z}/{x}/{y}.png")
We ran this in QGIS 3.40.12 with a fresh profile. The Browser then listed Mapzen Global Terrain, OpenStreetMap and Sentinel-2 cloudless 2016 (EOX) under XYZ Tiles, and the OpenStreetMap layer was valid and drawn; that is the screenshot near the top of this post. XYZ layers use the wms data provider, and the layer source is a URL-encoded string:
type=xyz&url=https://tile.openstreetmap.org/%7Bz%7D/%7Bx%7D/%7By%7D.png&zmax=19&zmin=0The same QgsRasterLayer(source, name, "wms") call works in standalone scripts outside the QGIS desktop. Our script runs headless with python-qgis-ltr.bat and renders both basemaps to PNG with QgsMapRendererParallelJob (console output). There is no iface in a standalone script, so add layers with QgsProject.instance().addMapLayer().
The same basemaps in Python: folium, leafmap and contextily
The XYZ URL is the same in any tool, and so are the attribution and the usage policy. Here are the Python equivalents, using the same Holderness view. They were tested with folium 0.20.0, leafmap 0.63.1 and contextily 1.7.1 (full script).
folium (interactive Leaflet map). OpenStreetMap is folium’s default. For any other XYZ layer, pass the URL and an attribution string, which is required:
import folium
OSM_URL = "https://tile.openstreetmap.org/{z}/{x}/{y}.png"OSM_ATTR = '© <a href="https://www.openstreetmap.org/copyright">OpenStreetMap</a> contributors'EOX_URL = "https://tiles.maps.eox.at/wmts/1.0.0/s2cloudless_3857/default/g/{z}/{y}/{x}.jpg"EOX_ATTR = ('<a href="https://s2maps.eu">Sentinel-2 cloudless - https://s2maps.eu</a> ' "by EOX IT Services GmbH (contains modified Copernicus Sentinel data 2016)")
m = folium.Map(location=[53.75, 0.01], zoom_start=11, tiles=None)folium.TileLayer(OSM_URL, attr=OSM_ATTR, name="OpenStreetMap", max_zoom=19).add_to(m)folium.TileLayer(EOX_URL, attr=EOX_ATTR, name="Sentinel-2 cloudless 2016", max_zoom=14).add_to(m)folium.LayerControl().add_to(m)m.save("folium_basemaps.html")For more on folium, including switchable basemaps, see Interactive web maps from Python with Folium and GeoPandas .explore().
leafmap wraps folium and ipyleaflet. It has named basemaps, and add_tile_layer accepts any XYZ URL:
import leafmap.foliumap as leafmap
m = leafmap.Map(center=[53.75, 0.01], zoom=11)m.add_tile_layer(url=EOX_URL, name="Sentinel-2 cloudless 2016", attribution=EOX_ATTR)m.to_html("leafmap_basemaps.html")
Two things we found when checking leafmap 0.63.1. Its named "SATELLITE" and "HYBRID" basemaps are Esri World Imagery, so Esri’s terms apply. Its "OpenStreetMap" entry still uses the deprecated {s}.tile.openstreetmap.org subdomains, so pass the canonical URL to add_tile_layer instead.
contextily puts a static basemap under a matplotlib or GeoPandas plot. It reads the provider URL and attribution from xyzservices. Pass a headers dict so the tile server can identify your project, as the OSM policy asks:
import contextily as cximport matplotlib.pyplot as pltimport xyzservices.providers as xyzfrom pyproj import Transformer
to_merc = Transformer.from_crs("EPSG:4326", "EPSG:3857", always_xy=True)x0, y0 = to_merc.transform(-0.10, 53.70)x1, y1 = to_merc.transform(0.12, 53.80)
fig, ax = plt.subplots(figsize=(6, 5))ax.set_xlim(x0, x1)ax.set_ylim(y0, y1)cx.add_basemap(ax, crs="EPSG:3857", source=xyz.OpenStreetMap.Mapnik, zoom=11,               headers={"User-Agent": "my-project/1.0 (you@example.com)"})ax.set_axis_off()fig.savefig("osm_holderness.png", dpi=150)
cx.add_basemap also writes the provider’s attribution on the axes by default. For Esri imagery use source=xyz.Esri.WorldImagery; for any other XYZ service, pass its URL string as source.
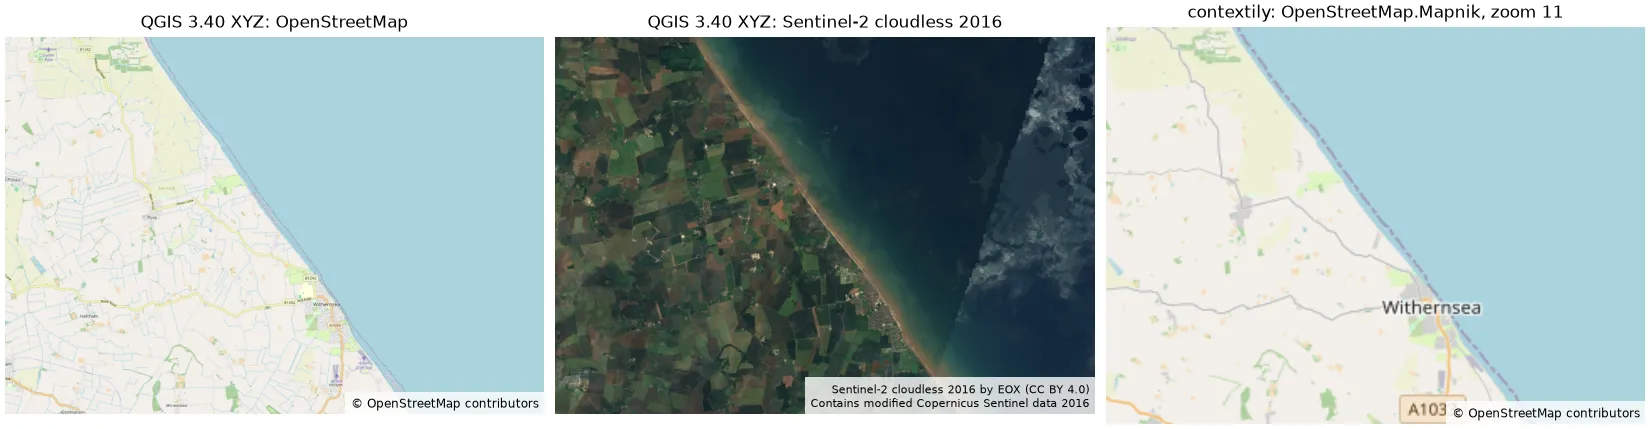 The same XYZ services from QGIS and Python, over the Holderness coast around Withernsea (0.10° W to 0.12° E, 53.70° to 53.80° N). Left and centre: rendered headless with PyQGIS 3.40.12. Right: contextily 1.7.1. All three are real renders made for this post, with the attribution each licence requires.
Troubleshooting
- Blank layer or grey tiles: check the URL for a
$before the placeholders,http://instead ofhttps://, or{x}/{y}in the wrong order for that provider. Copy the URL from the table above. - HTTP 403 or “Access blocked” tiles from OpenStreetMap: the server thinks you are breaking the usage policy, often through a missing User-Agent (in scripts) or bulk downloading.
- Blurry tiles when zoomed in: you have passed the connection’s maximum zoom (19 for OSM, 14 for EOX), so QGIS is stretching the last level. That’s expected.
- Fuzzy labels in a British National Grid project: the tiles are being reprojected from EPSG:3857. Use EPSG:3857 for screen work, or a vector basemap.
- Errors on a corporate network: set the proxy under Settings › Options › Network.
Frequently asked questions
Can I add Google Maps to QGIS?
Yes, but the only compliant way is Google’s billed Map Tiles API: an API key, a session token, and the Google Maps logo and data attribution on the map. The free mt0/mt1.google.com URLs found online are undocumented and using them breaks the Google Maps Platform terms.
Is it legal to use Google Satellite in QGIS for digitising?
No. Even through the official API, the Google Maps Platform terms forbid creating content from Google Maps content, and tracing roads or buildings from satellite imagery is the terms’ own example. Google’s tile policies also exclude image analysis, object detection and offline use. Digitise from imagery whose licence allows it.
What is the correct OpenStreetMap URL for QGIS?
https://tile.openstreetmap.org/{z}/{x}/{y}.png, with a maximum zoom of 19. QGIS already includes this connection as OpenStreetMap under XYZ Tiles. Old URLs using ${z} fail with HTTP 400, and the a./b./c. subdomains are deprecated.
Do I need to credit OpenStreetMap in my maps?
Yes. Every map that uses OSM tiles or data needs “© OpenStreetMap contributors” visible on the map, with a link to the copyright page where that’s possible. In QGIS, add a copyright decoration on screen and a label in each print layout.
Can I download basemap tiles for offline use in QGIS?
Not from the standard OpenStreetMap tiles or Google, whose terms forbid bulk downloading and offline use. Esri says its standard World Imagery layer is not intended for offline export either. For offline maps, use OSM data itself (for example from Geofabrik extracts), openly licensed imagery you download, or a provider whose licence covers offline use.
What happened to the OpenLayers plugin?
It was a QGIS 2 plugin and was never ported to QGIS 3. XYZ Tiles connections, built into QGIS since version 2.18, replaced it, and the QuickMapServices plugin provides a ready-made catalogue.
How do I show the same basemap in Python?
Use the same URL template: folium.TileLayer(url, attr=...), leafmap.Map().add_tile_layer(url=..., attribution=...) or contextily.add_basemap(ax, source=...). Keep the attribution and send an identifying User-Agent from scripts.
Related tutorials
- Interactive web maps from Python with Folium and GeoPandas .explore(): basemaps, layer control and choropleths in folium.
- Coastal erosion and shoreline change from Sentinel-2 in Python: the Holderness coast shown in the figures above, measured from 2017 to 2026.
- Measuring Lake Mead’s shrinking shoreline with Sentinel-2, STAC and Python: get your own open satellite imagery instead of relying on a basemap.
Sources
- OpenStreetMap Foundation, Tile Usage Policy.
- QGIS 3.40.12,
apps/qgis-ltr/resources/qgis_global_settings.ini(default XYZ connections), and the QGIS version check (3.44 LTR and 4.2, October 2026). - Google, Map Tiles API: 2D Tiles overview, session tokens and policies; Google Maps Platform Terms of Service, section 3.2.3.
- Esri, World Imagery item and licence.
- EOX IT Services, Sentinel-2 cloudless. Contains modified Copernicus Sentinel data 2016.
- NextGIS QuickMapServices 1.5.2, QGIS plugin repository.
Key terms
- XYZ tiles
- Map images served as 256 × 256 pixel tiles in Web Mercator (EPSG:3857), addressed by zoom level (z), column (x) and row (y) in a URL template such as https://tile.openstreetmap.org/{z}/{x}/{y}.png.
- Tile Map Service (TMS)
- A web service that serves pre-rendered map tiles. QGIS connects to XYZ-style services through an XYZ Tiles connection; the TMS standard itself numbers rows from the bottom, so its URLs use {-y}.
- Tile usage policy
- The rules a tile provider sets for its servers, such as attribution, an identifying User-Agent, caching and no bulk downloading. They apply on top of the data licence.
- Map Tiles API
- Google Maps Platform's documented, billed API for 2D roadmap, satellite and terrain tiles. It needs an API key and a session token, and the map must show the Google Maps logo and data attribution.
Data for this article
- OpenStreetMap · ODbL 1.0; the standard tile layer is subject to the OSMF tile usage policy
- Sentinel-2 cloudless (EOX) · CC BY 4.0 for the 2016 mosaic; CC BY-NC-SA 4.0 for 2018 and later
- Esri World Imagery · Esri Master License Agreement; attribution required
- Google Map Tiles API · Billed Google Maps Platform API; key, session token and logo required
Licences and formats for each source are listed in the GIS data sources catalogue.