#GeoPandas

17 posts

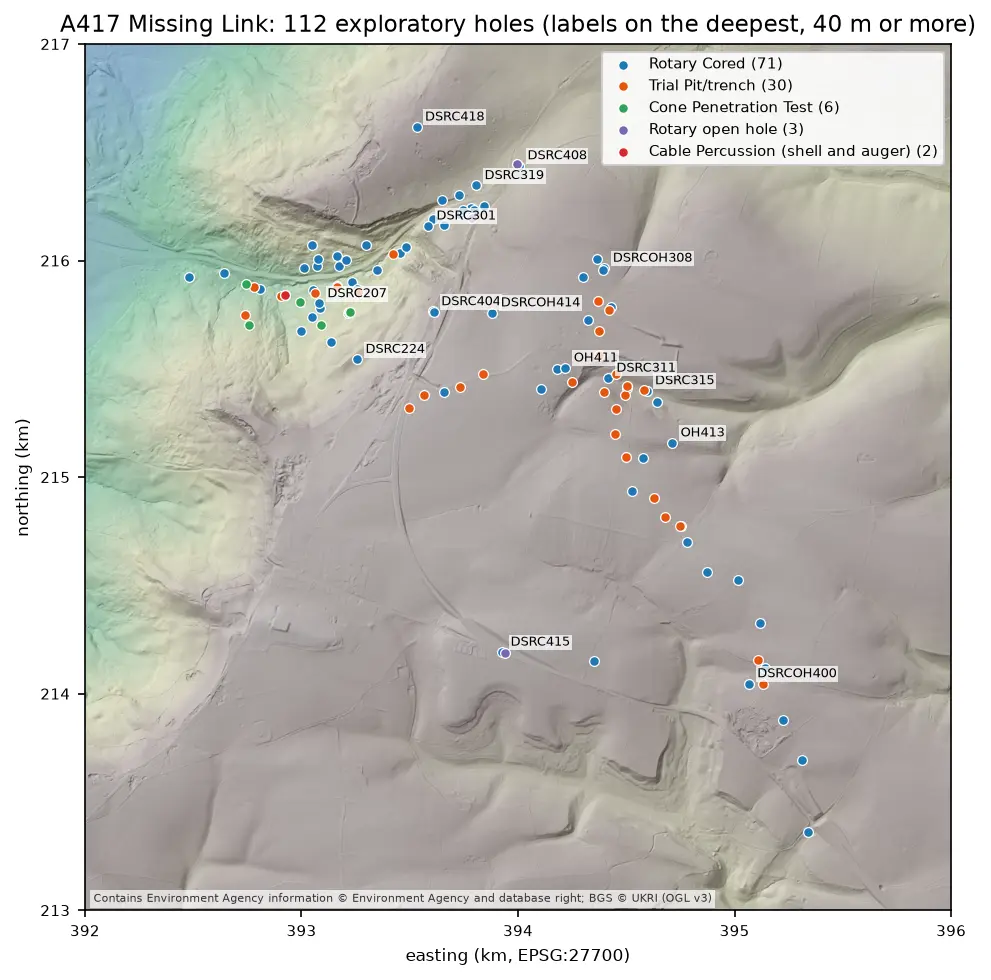
Map of the A417 Missing Link ground investigation on a grey LIDAR hillshade: 112 coloured points for rotary cored boreholes, trial pits, cone penetration tests, open holes and cable percussion boreholes, strung along the road corridor from the vale in the north-west, up the escarpment and south-east across the plateau, with the deepest holes labelled.

Tutorial Python Part 2 of 7

Boreholes on a map: AGS4 locations in British National Grid with QGIS

Turn the LOCA group of a real AGS4 file into points in British National Grid, see what happens when the CRS is wrong, summarise each hole's geology from GEOL, check every ground level against Environment Agency LIDAR, and build a QGIS project with labels and a map tip that shows the borehole log.
Intermediate 8 min read

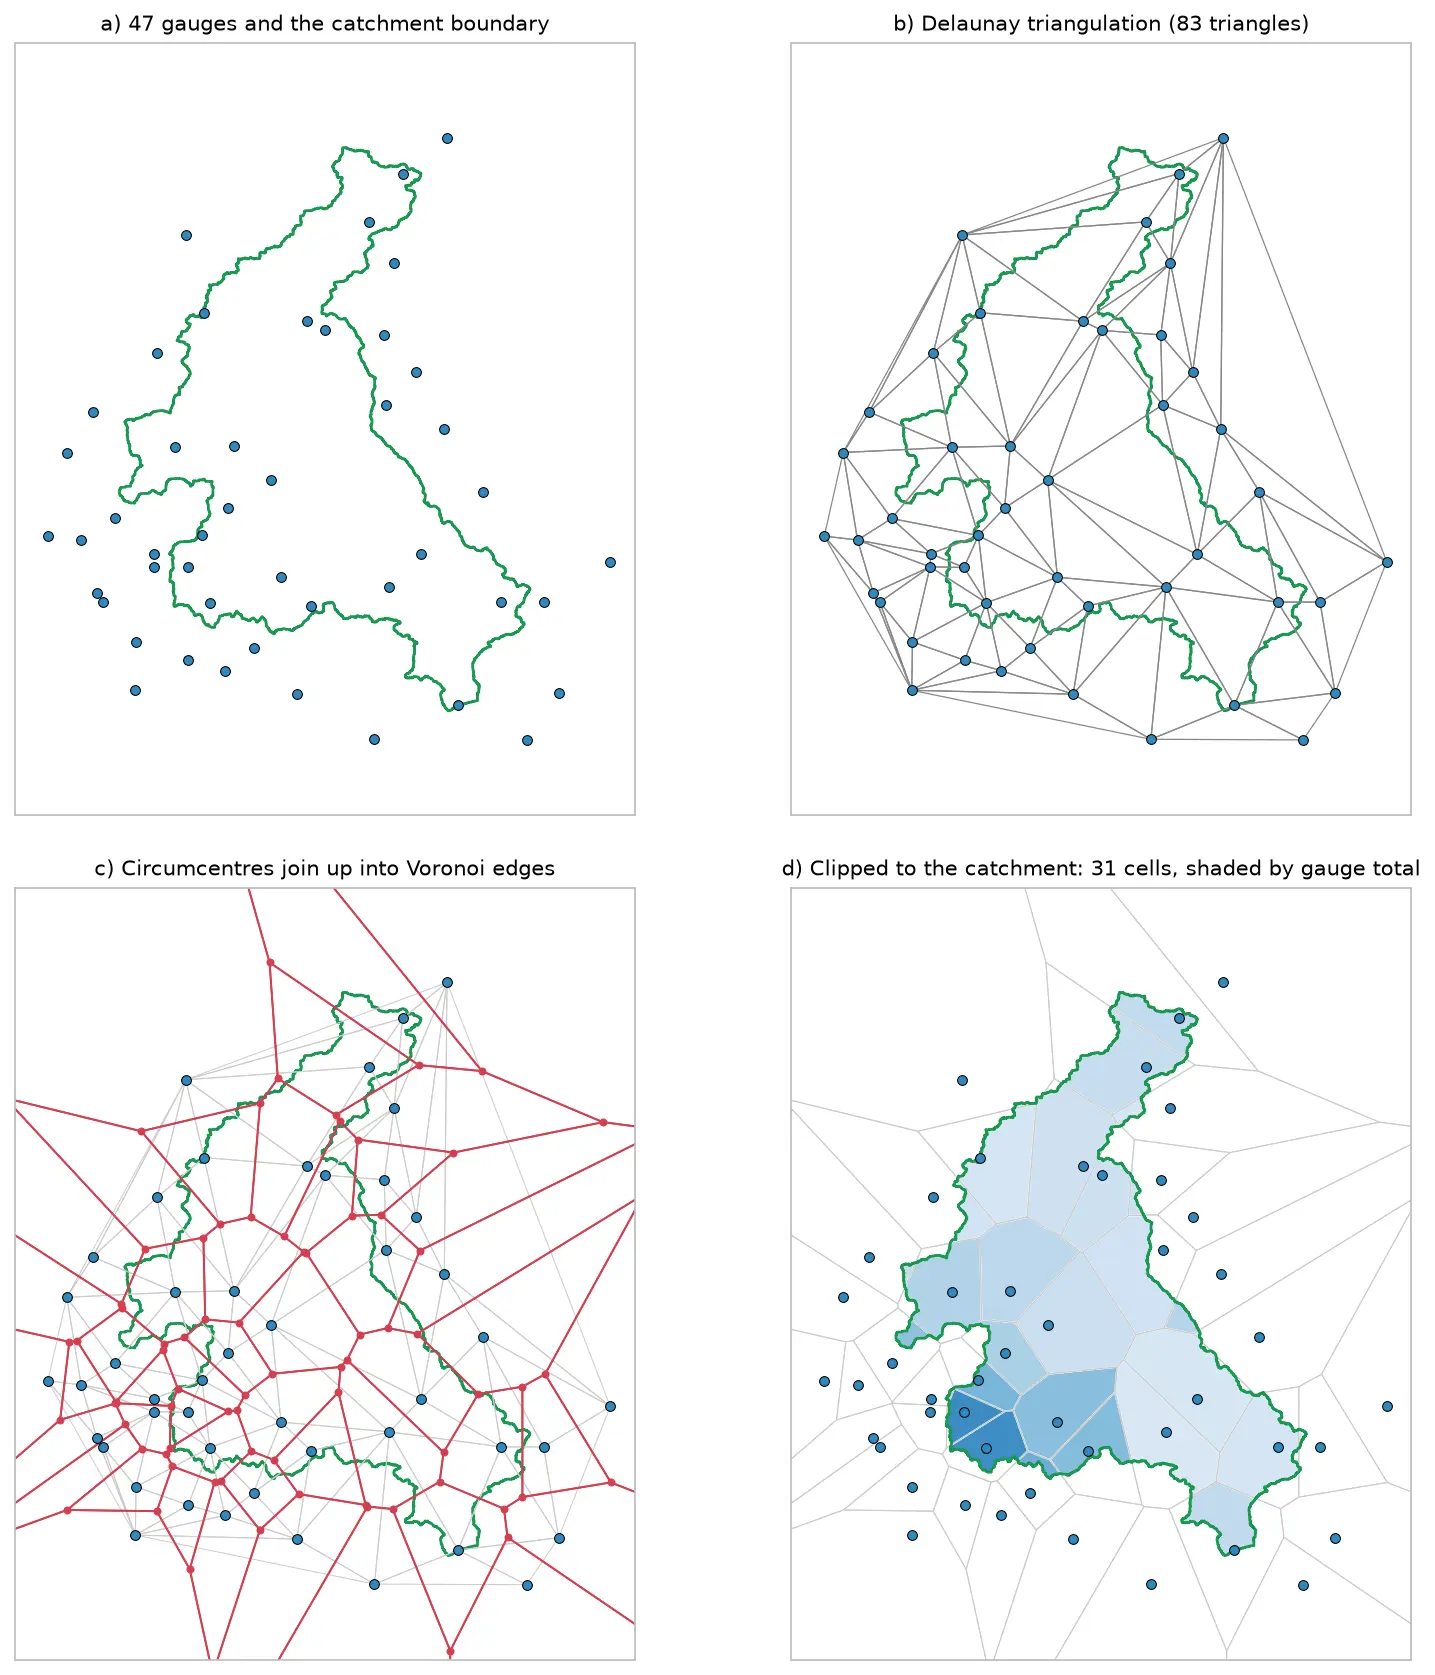
Four panels showing how Voronoi polygons are built for 47 rain gauges around the River Eden catchment: the gauges and the catchment outline, their Delaunay triangulation, the triangle circumcentres joined into red Voronoi edges, and the cells clipped to the catchment and shaded by each gauge's rainfall.

Tutorial Python

Voronoi (Thiessen) polygons in Python: catchment rainfall from EA rain gauges and fire station areas in Cumbria

Build Voronoi (Thiessen) polygons in Python with shapely and GeoPandas, clipped to a real boundary. Compute Thiessen-weighted catchment rainfall for the River Eden from Environment Agency rain gauge readings, check the gauges, compare with the gauge average and IDW, then compare Voronoi 'nearest fire station' areas in Cumbria with drive-time service areas from OpenStreetMap.

Intermediate 15 min read

Tutorial Python

Geocoding in Python: batch and reverse geocoding with geopy, Nominatim and postcodes.io

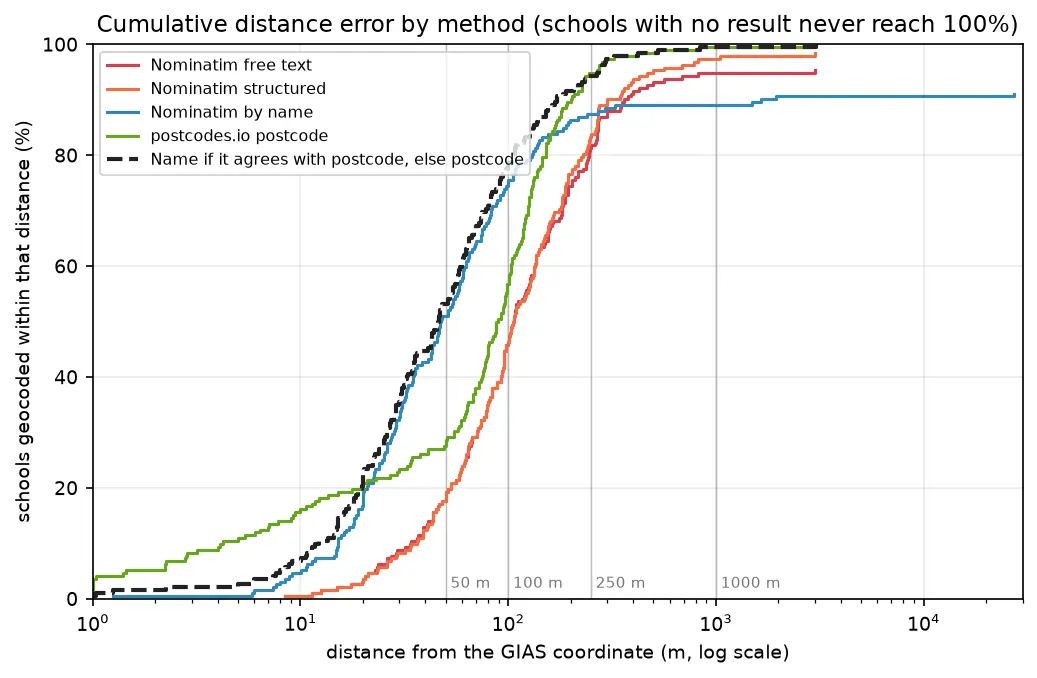
Batch geocode all 192 open schools in Sheffield in Python with geopy and OpenStreetMap Nominatim (1 request per second, a custom user agent and an on-disk cache) and with postcodes.io bulk postcode lookups, reverse geocode a sample, and measure every method honestly against the Department for Education's own coordinates. Covers free text against structured queries, failure modes, cross-checking two geocoders, and the licensing of geocoded results.

Beginner 14 min read

Tutorial Python

GPS data analysis in Python with MovingPandas: trajectories, speed, stops, generalisation and flow maps

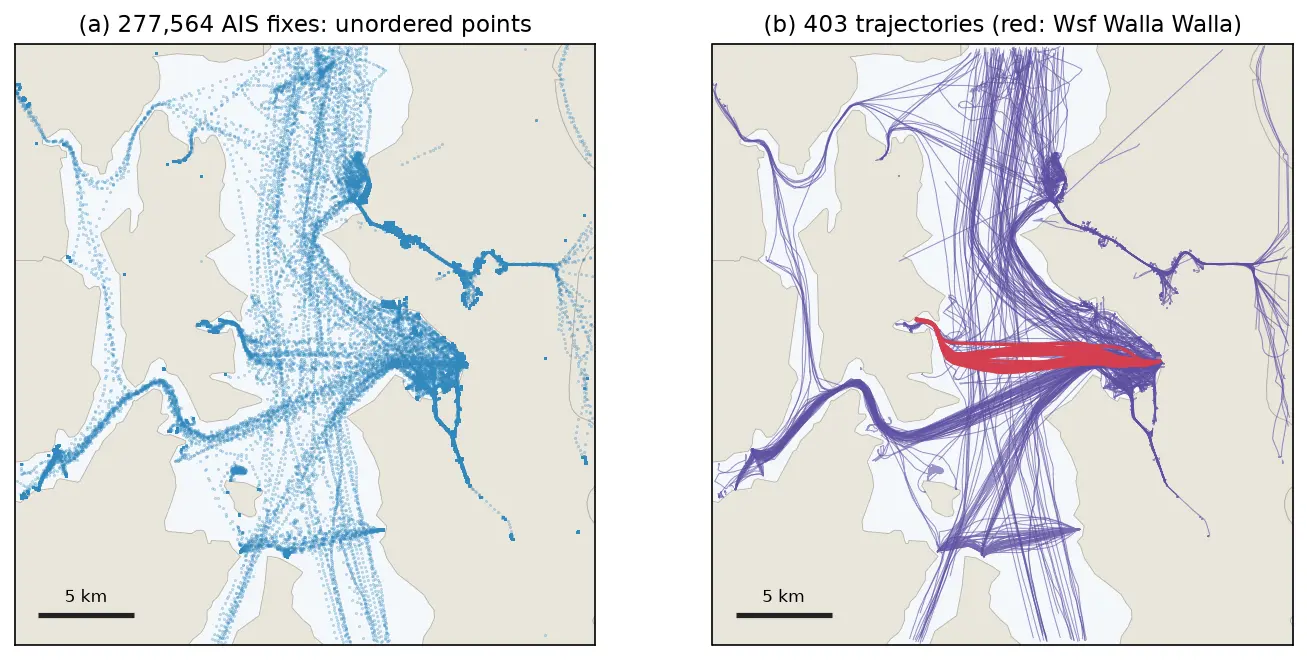
A MovingPandas tutorial on one day of real AIS vessel tracks in Puget Sound: 277,574 GPS fixes from 703 vessels turned into trajectories, with speed and direction, outlier cleaning, stop detection at ferry terminals, splitting into 148 trips, Douglas-Peucker against time-aware generalisation, a flow map of 319 aggregated flows, and reading and writing GPX.

Intermediate 14 min read

Tutorial Python

DBSCAN and HDBSCAN spatial clustering in Python: finding Glasgow's dining districts

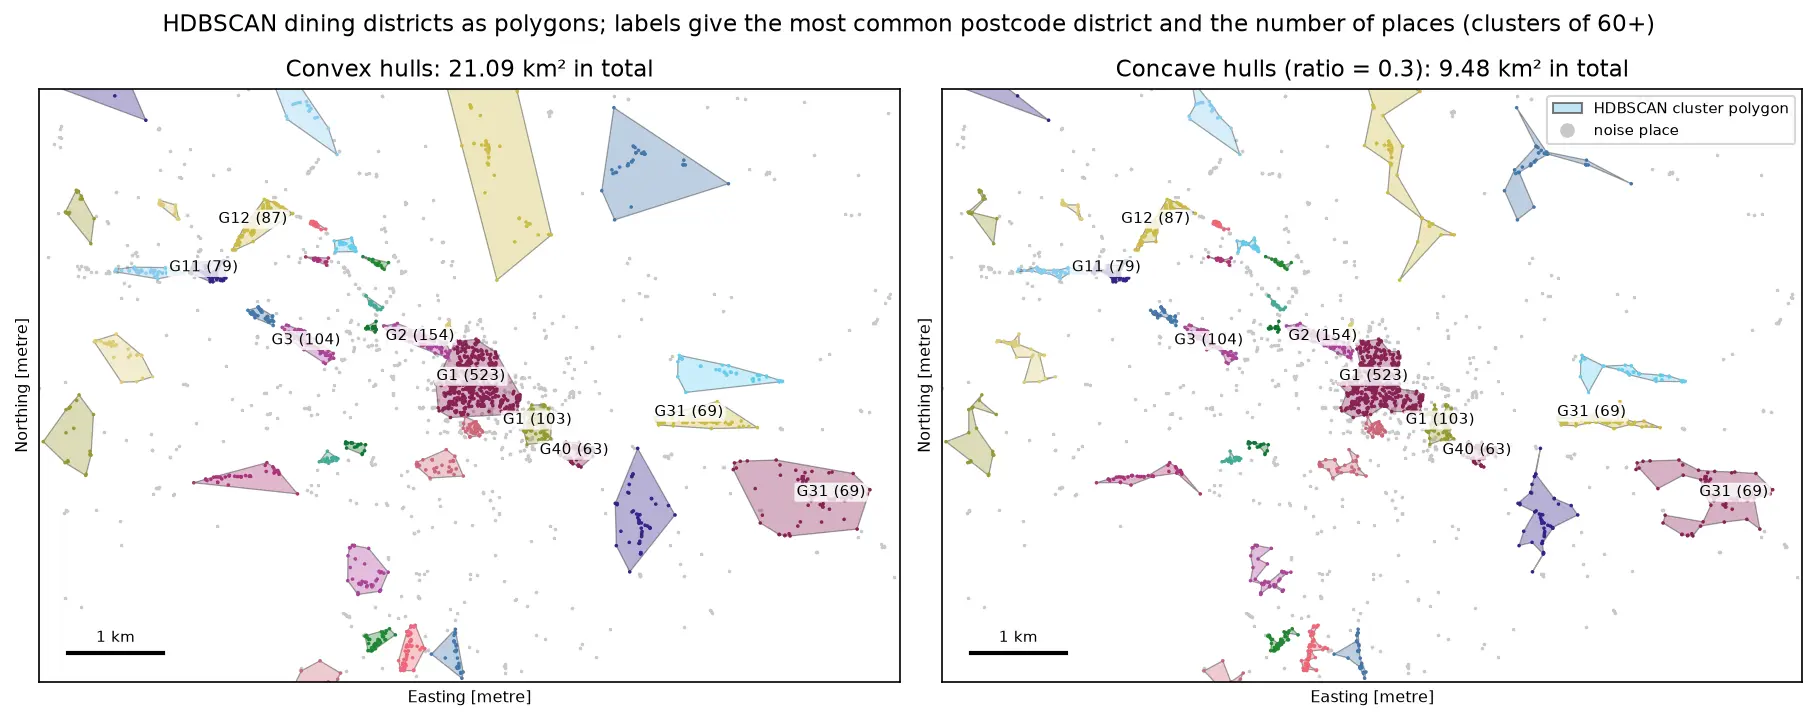
Cluster GPS and point-of-interest data in Python with DBSCAN and HDBSCAN: use the haversine metric on latitude and longitude or plain metres on a projected grid, choose eps with a k-distance plot, handle variable density with HDBSCAN, draw convex and concave hull polygons, treat noise properly, read silhouette and DBCV with care, and scale up with a BallTree. Uses 3,950 real Overture Maps restaurants, cafés and bars in Glasgow.

Intermediate 18 min read

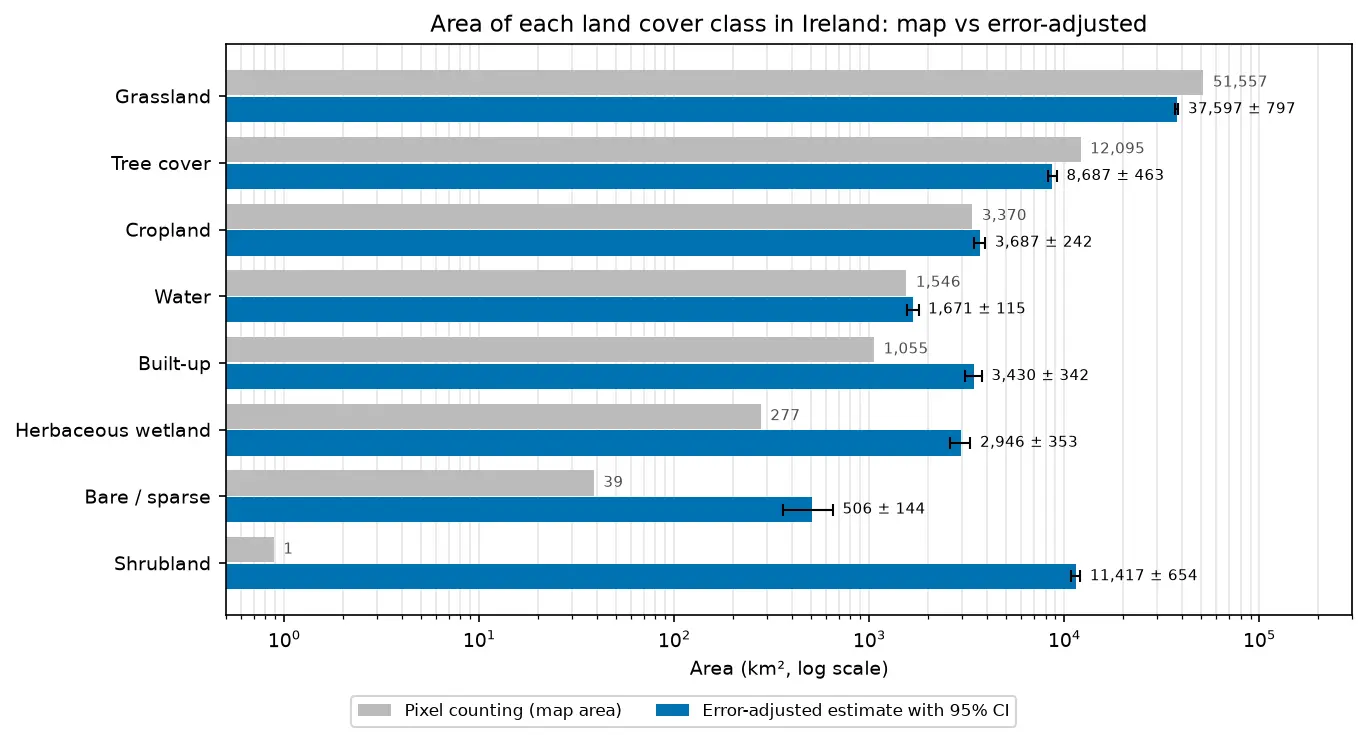
Bar chart comparing the area of each land cover class in Ireland from WorldCover pixel counting with the error-adjusted estimate and its 95% confidence interval.

Tutorial Remote Sensing

Land cover accuracy assessment in Python: confusion matrix, Olofsson area estimates and sample size

Assess a real land cover map in Python: ESA WorldCover 2021 against 8,597 Eurostat LUCAS 2022 field survey points in Ireland. Build the confusion matrix, compute overall, user's and producer's accuracy, see why kappa is discouraged, and use the Olofsson et al. (2014) stratified estimators to get error-adjusted areas with 95% confidence intervals and to plan a new stratified random sample.

Advanced 20 min read

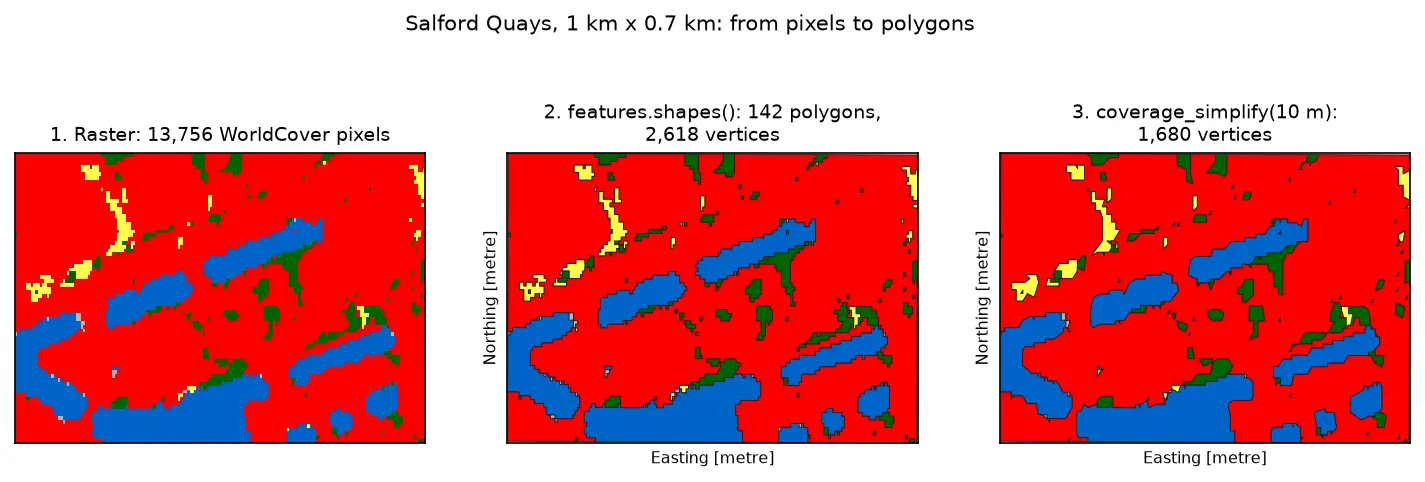
Three panels of the same 1 km by 0.7 km area at Salford Quays. Left: square WorldCover pixels, mostly red built-up land with blue dock basins and small green and yellow patches. Middle: the same area as 142 polygons with black outlines that follow the pixel staircase. Right: the polygons after coverage simplification at 10 m, with smoother outlines and no gaps between them.

Tutorial Python Part 3 of 3

Raster to vector in Python: polygonize with rasterio, rasterize boundaries and convert a GeoTIFF to a Cloud Optimized GeoTIFF

Convert raster to vector in Python with rasterio.features.shapes on 10 m ESA WorldCover for Greater Manchester: polygonize water and built-up land, fix invalid polygons, simplify without gaps, rasterize ONS district boundaries for land-cover shares, then write and validate a Cloud Optimized GeoTIFF with rio-cogeo and measure HTTP range reads.

Intermediate 14 min read

Tutorial Python Part 2 of 3

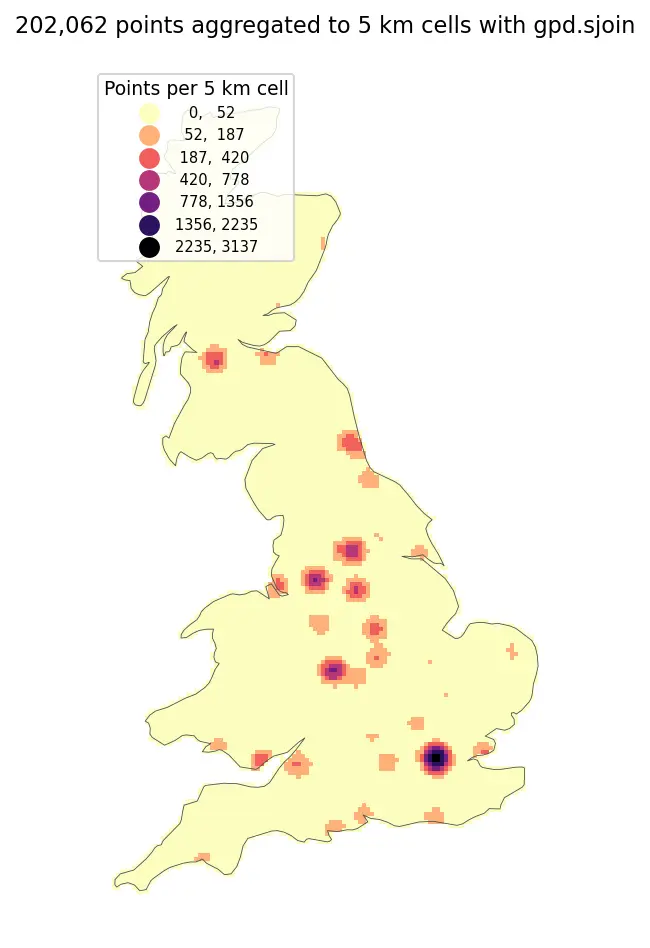
Spatial joins in GeoPandas: sjoin, predicates, sjoin_nearest and point in polygon

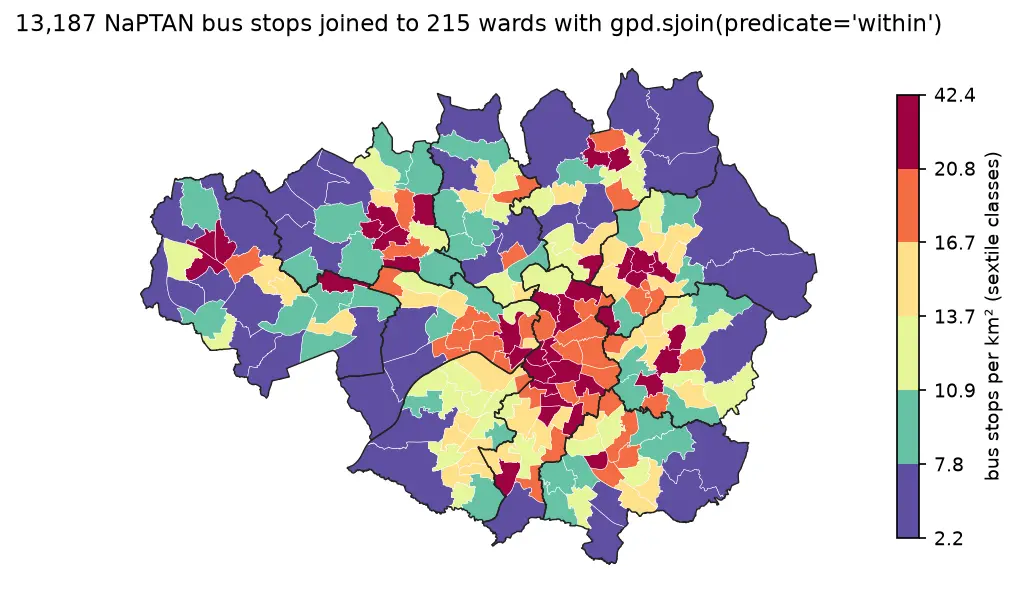
A practical guide to spatial joins in GeoPandas with real Greater Manchester data: 13,187 NaPTAN bus stops, 1,386 OpenStreetMap schools, 215 ONS wards and 1,702 LSOAs. Covers point in polygon with sjoin, predicates, counts per polygon, how='left'/'inner'/'right', sjoin_nearest with max_distance, clip and overlay, and a timing comparison of a naive loop against the spatial index.

Beginner 12 min read

Tutorial Python Part 1 of 3

Coordinate reference systems in Python: EPSG codes, pyproj transforms and reprojecting vectors and rasters

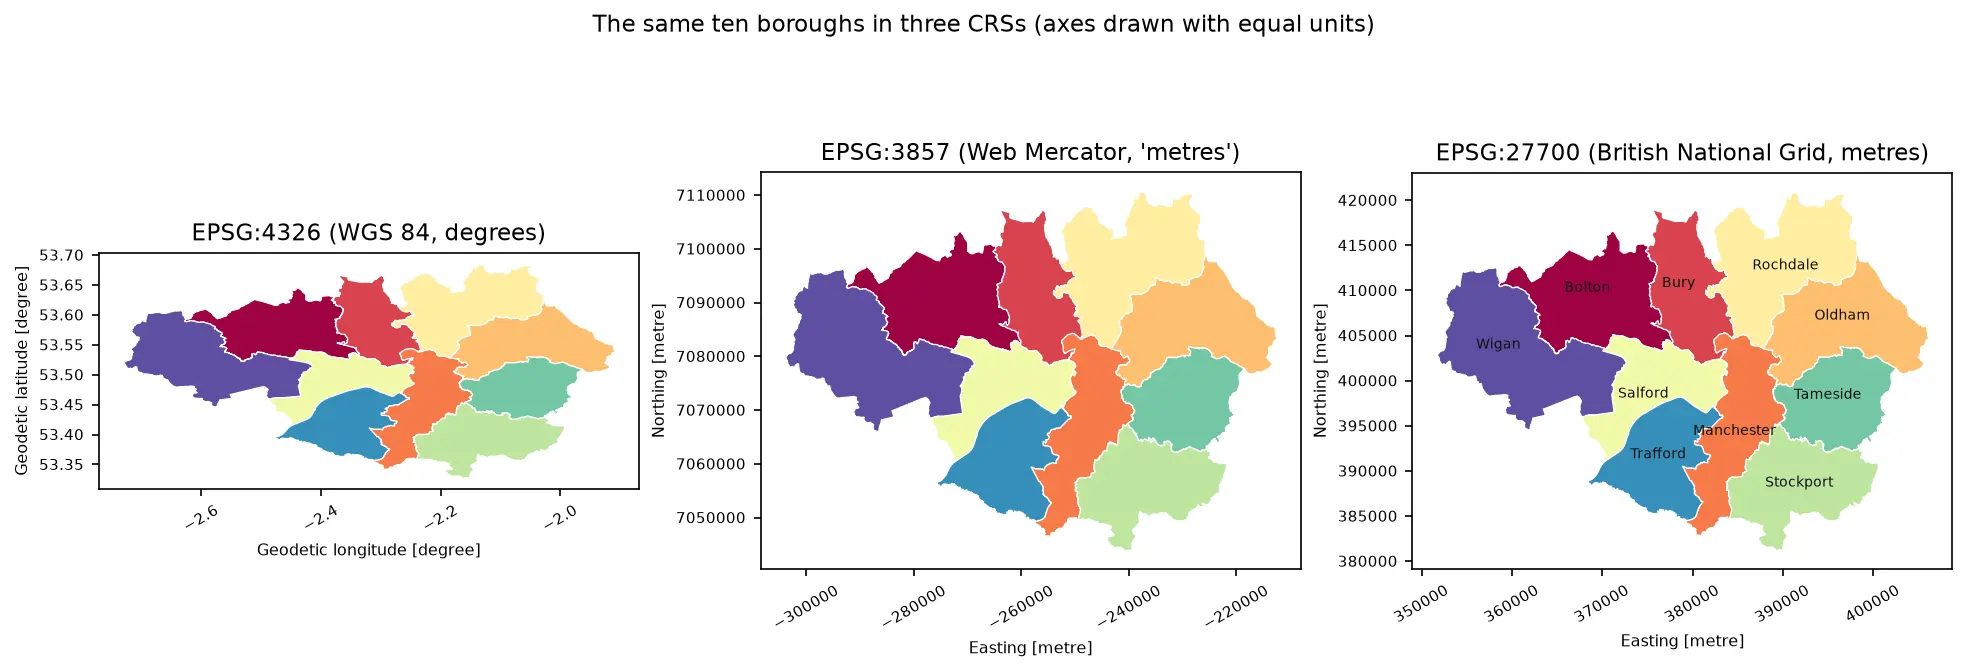
A practical guide to coordinate reference systems in Python with pyproj, GeoPandas and rasterio, tested on real Greater Manchester data. Covers EPSG codes, WGS 84 vs British National Grid (EPSG:27700), the always_xy axis-order trap, OSTN15 vs Helmert datum shifts checked against 13,187 NaPTAN bus stops, measured area and distance errors in the wrong CRS, and reprojecting a GeoDataFrame and a Copernicus DEM raster.

Beginner 13 min read

Tutorial Python

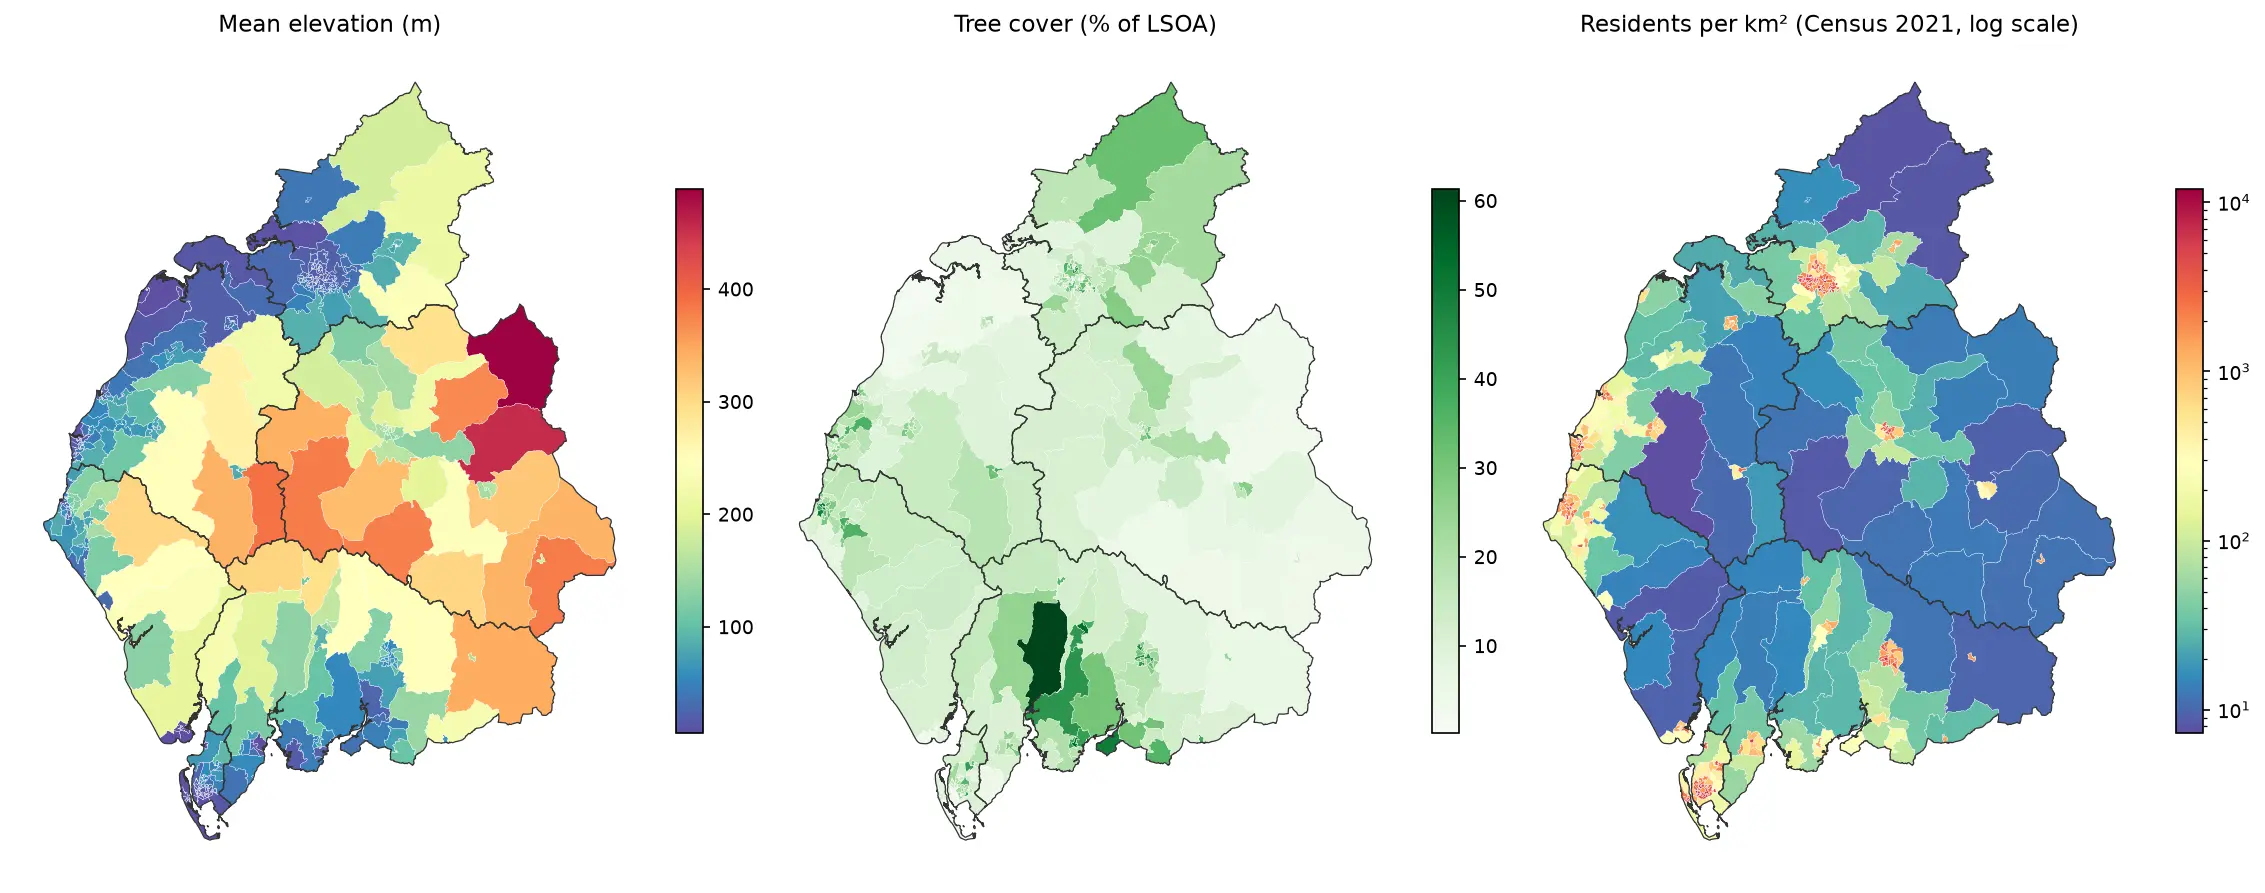
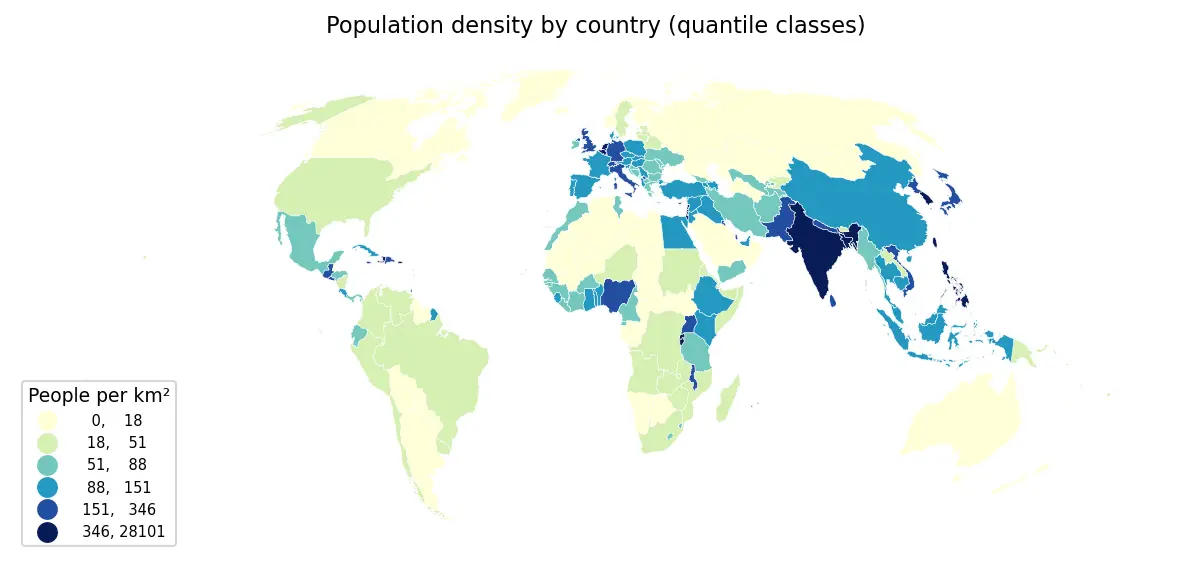
Zonal statistics in Python: exactextract vs rasterstats, with partial pixels, land-cover fractions and a benchmark

Calculate zonal statistics in Python with exactextract and rasterstats on real data: ONS 2021 LSOA boundaries for Cumbria with GHSL population, the Copernicus DEM and ESA WorldCover. Covers partial-pixel weighting vs pixel centroids, CRS alignment, categorical land-cover fractions, a speed benchmark, GeoPackage export and choropleth maps.

Intermediate 14 min read

Tutorial Python

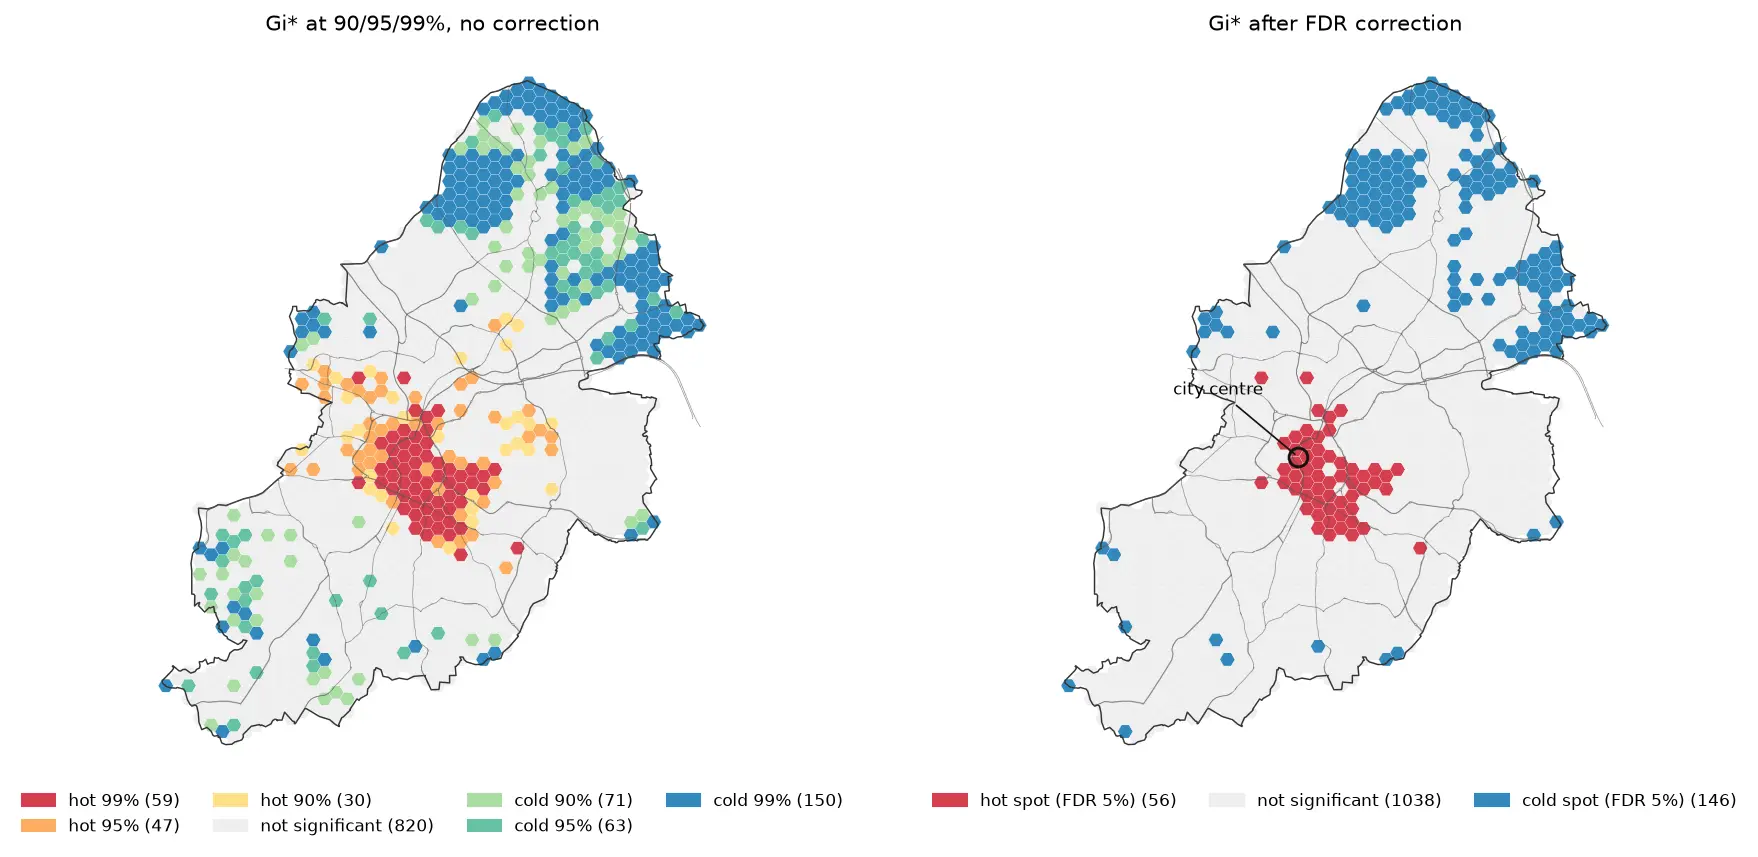
Hot spot analysis in Python: Getis-Ord Gi*, Moran's I and LISA on Birmingham road collisions

Run a hot spot analysis in Python with PySAL: aggregate 2025 STATS19 road collisions in Birmingham to a hexagon grid, test for clustering with global Moran's I, map Getis-Ord Gi* hot spots and LISA clusters with permutation inference and FDR correction, and see how spatial weights, the areal unit and exposure change the answer.

Intermediate 19 min read

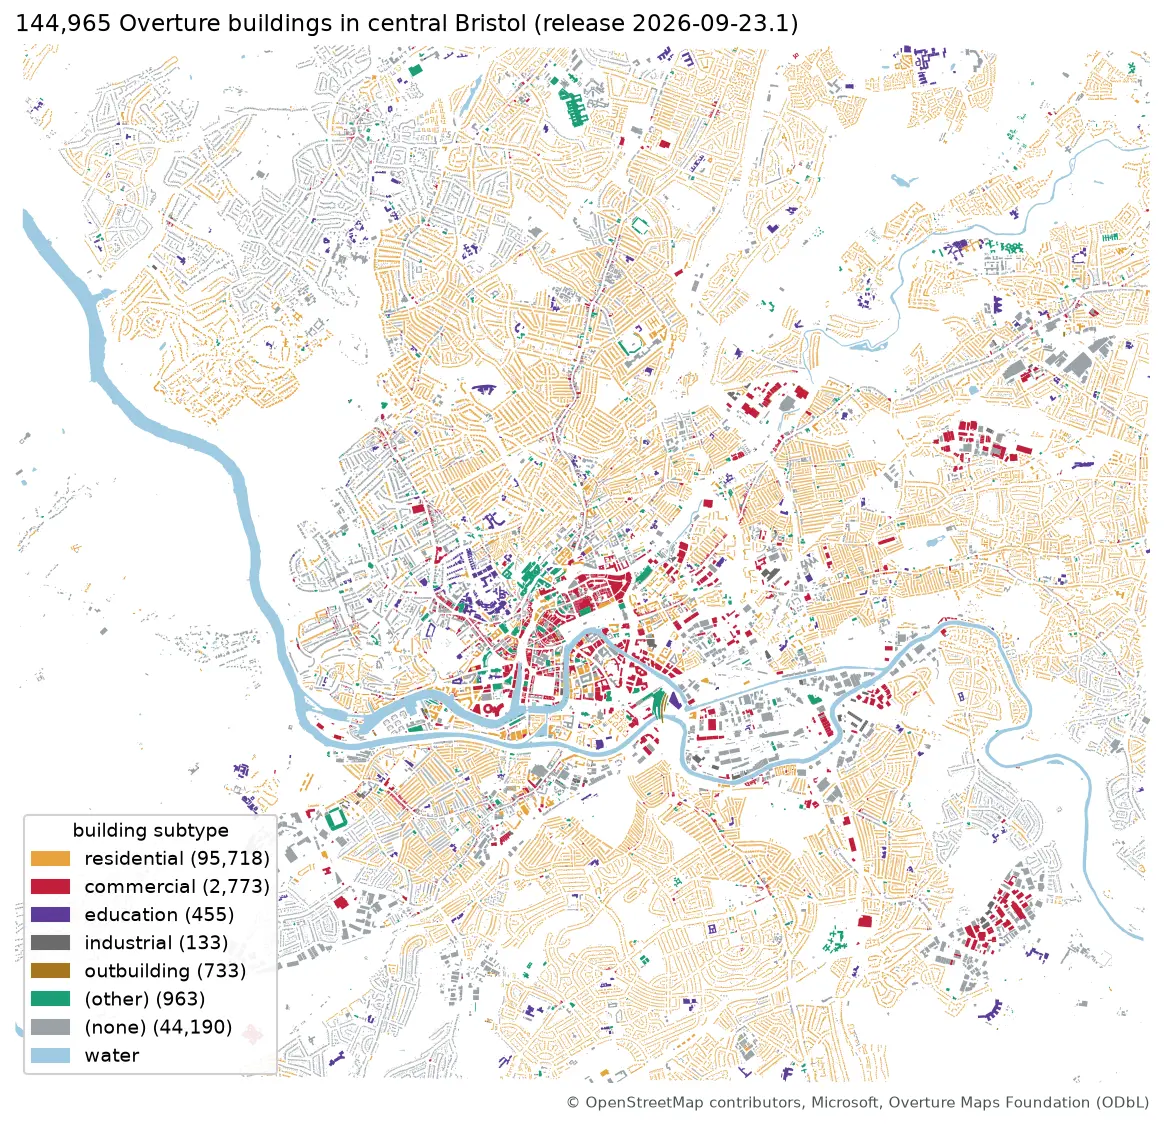
Map of central Bristol with 144,965 Overture building footprints coloured by subtype, most of them residential, and the River Avon in blue

Tutorial Python Part 1 of 2

Query Overture Maps with DuckDB spatial and GeoParquet in Python

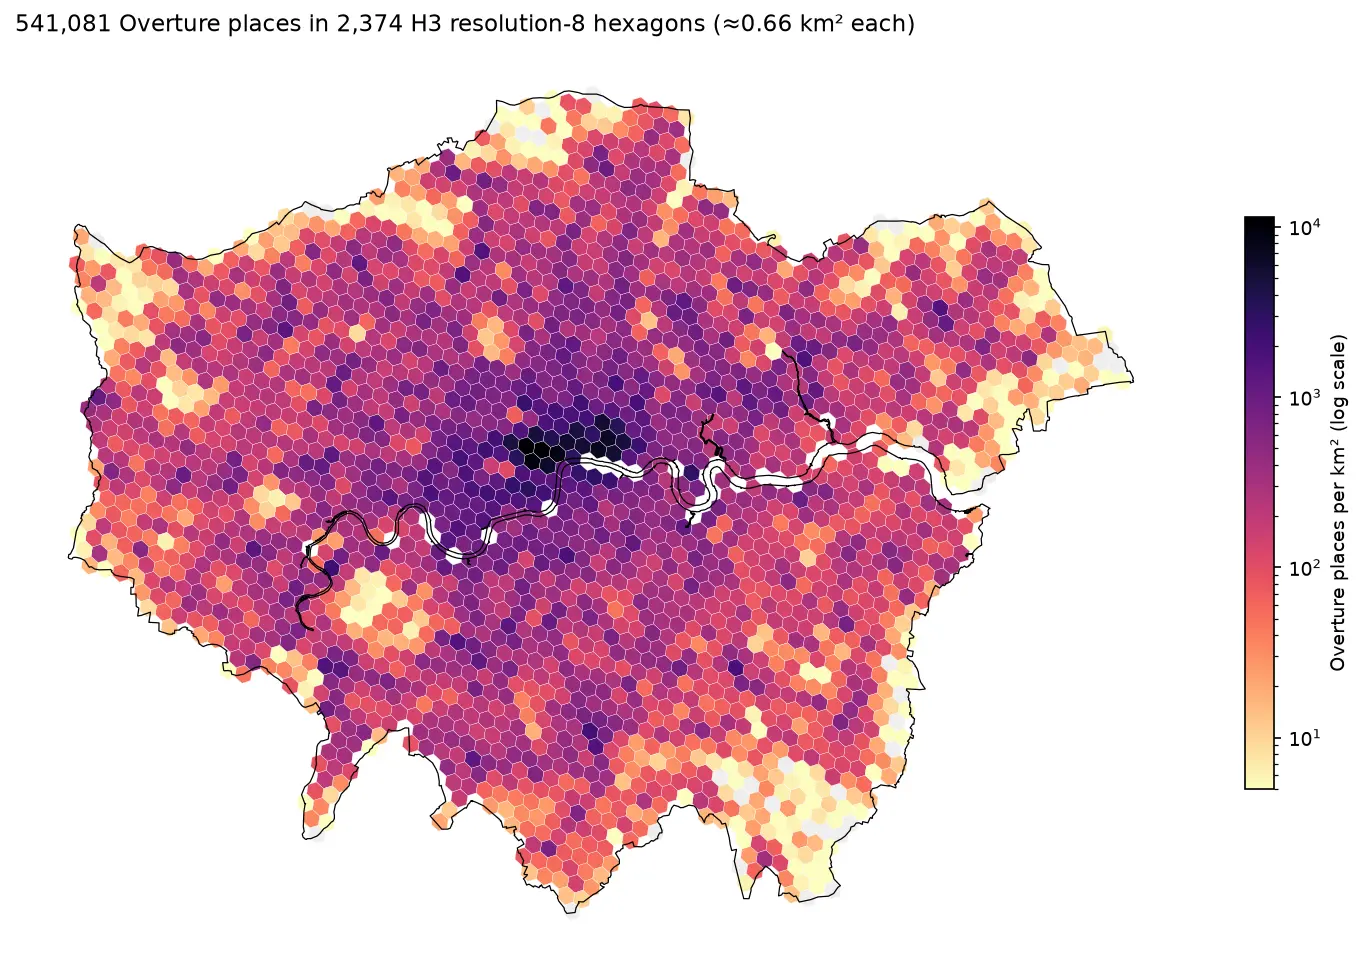
Pull Bristol's 144,965 buildings and 20,727 places straight from the Overture Maps GeoParquet release with DuckDB, run spatial SQL joins and H3 aggregation, load the result into GeoPandas, write GeoParquet 1.1, and time it against Shapefile, GeoPackage and FlatGeobuf.

Intermediate 13 min read

Tutorial Python

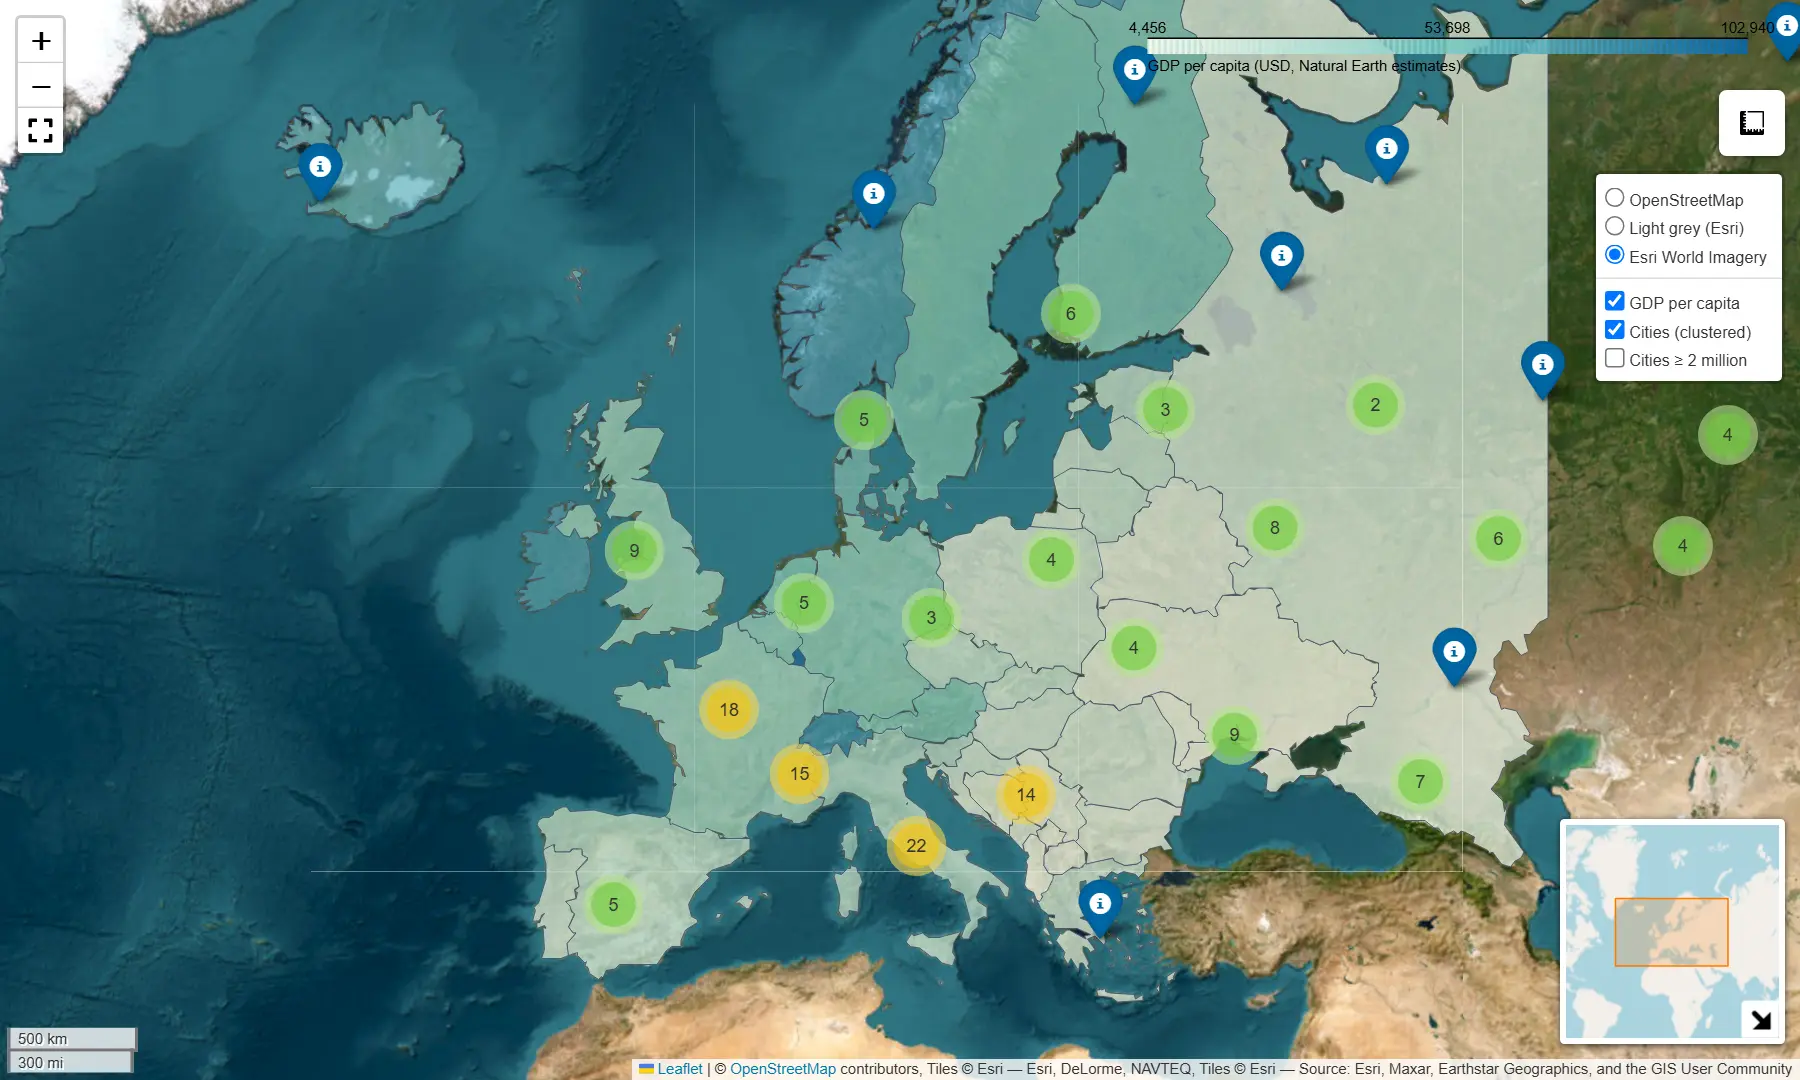
Interactive web maps from Python with Folium and GeoPandas .explore()

Turn GeoDataFrames into shareable Leaflet web maps: a one-line choropleth with .explore(), then a hand-built Folium map with custom styling, tooltips, clustered markers, switchable basemaps and plugins — saved as a single HTML file.

Beginner 5 min read